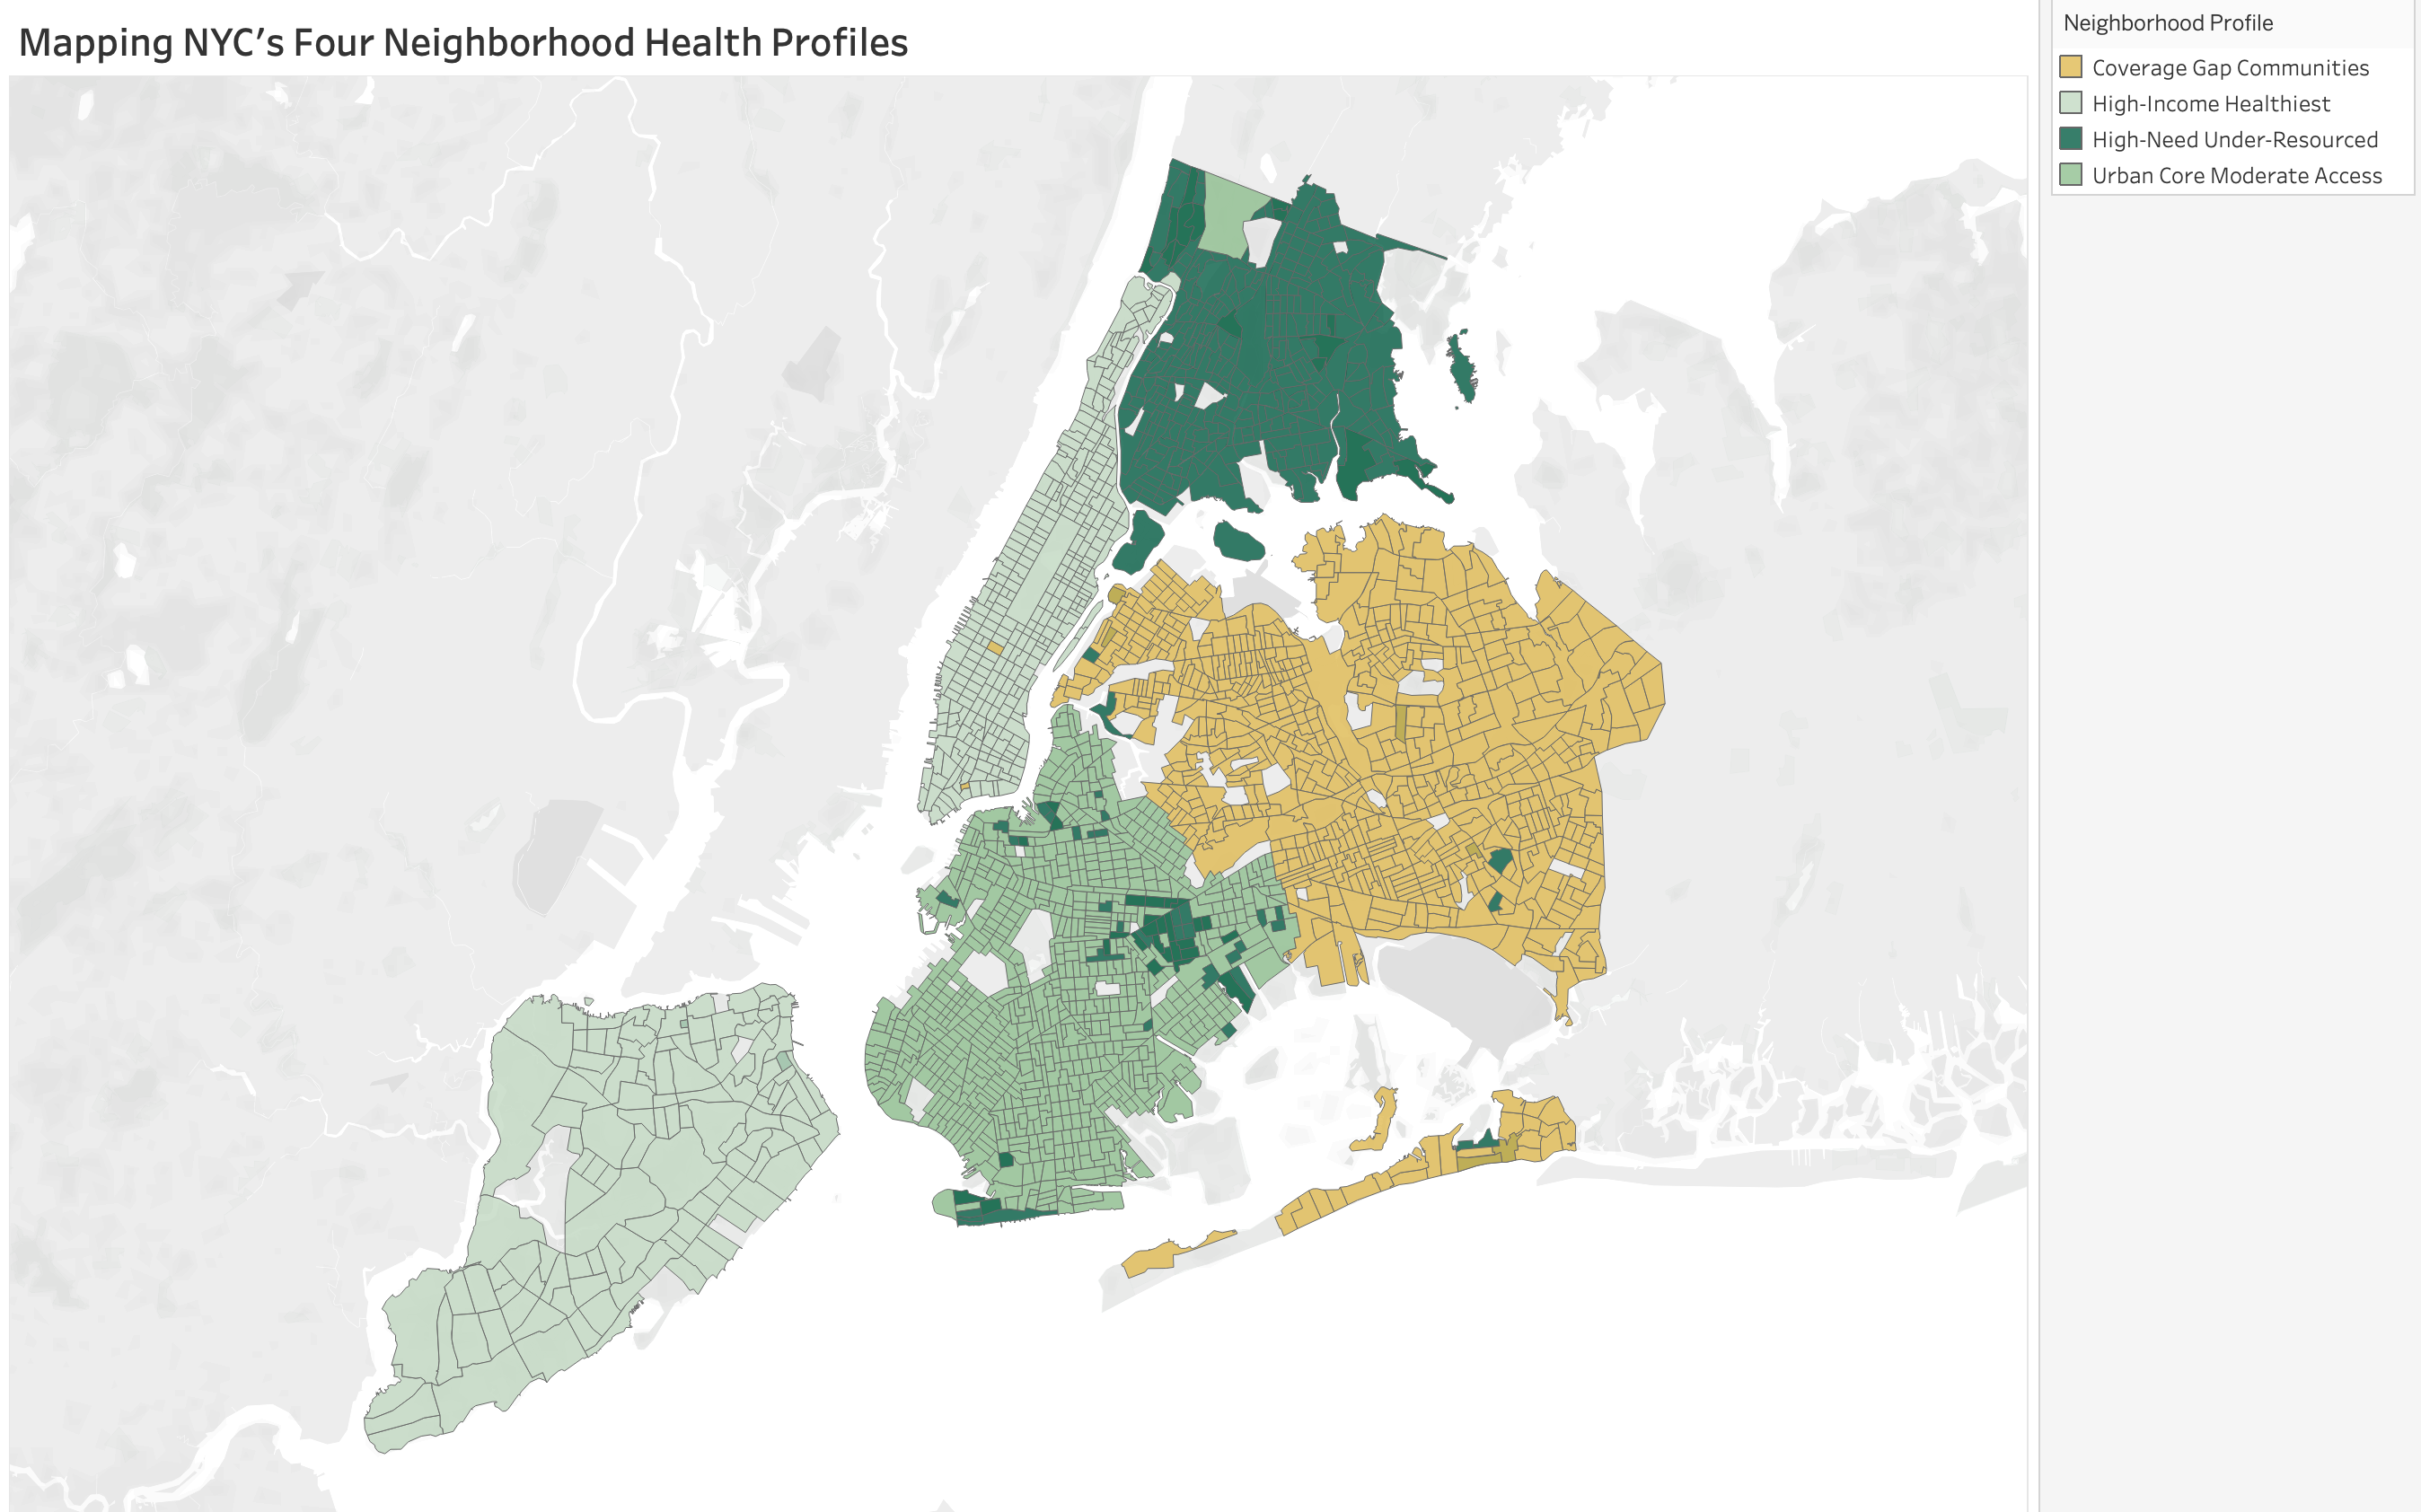
NYC Healthcare Access Equity Analysis
Analyzed 2,368 census tracts across NYC to reveal that income — not facility access — drives health disparities. The Bronx has the most facilities per capita (6.7 per 100K) yet the worst diabetes rate (14.2%). Segmented neighborhoods into four actionable health profiles for targeted investment using regression, clustering, and time series analysis.
Subscription Funnel Analysis
Analyzing user conversion and retention patterns to identify drop-off points and optimize the subscription funnel for a digital product.
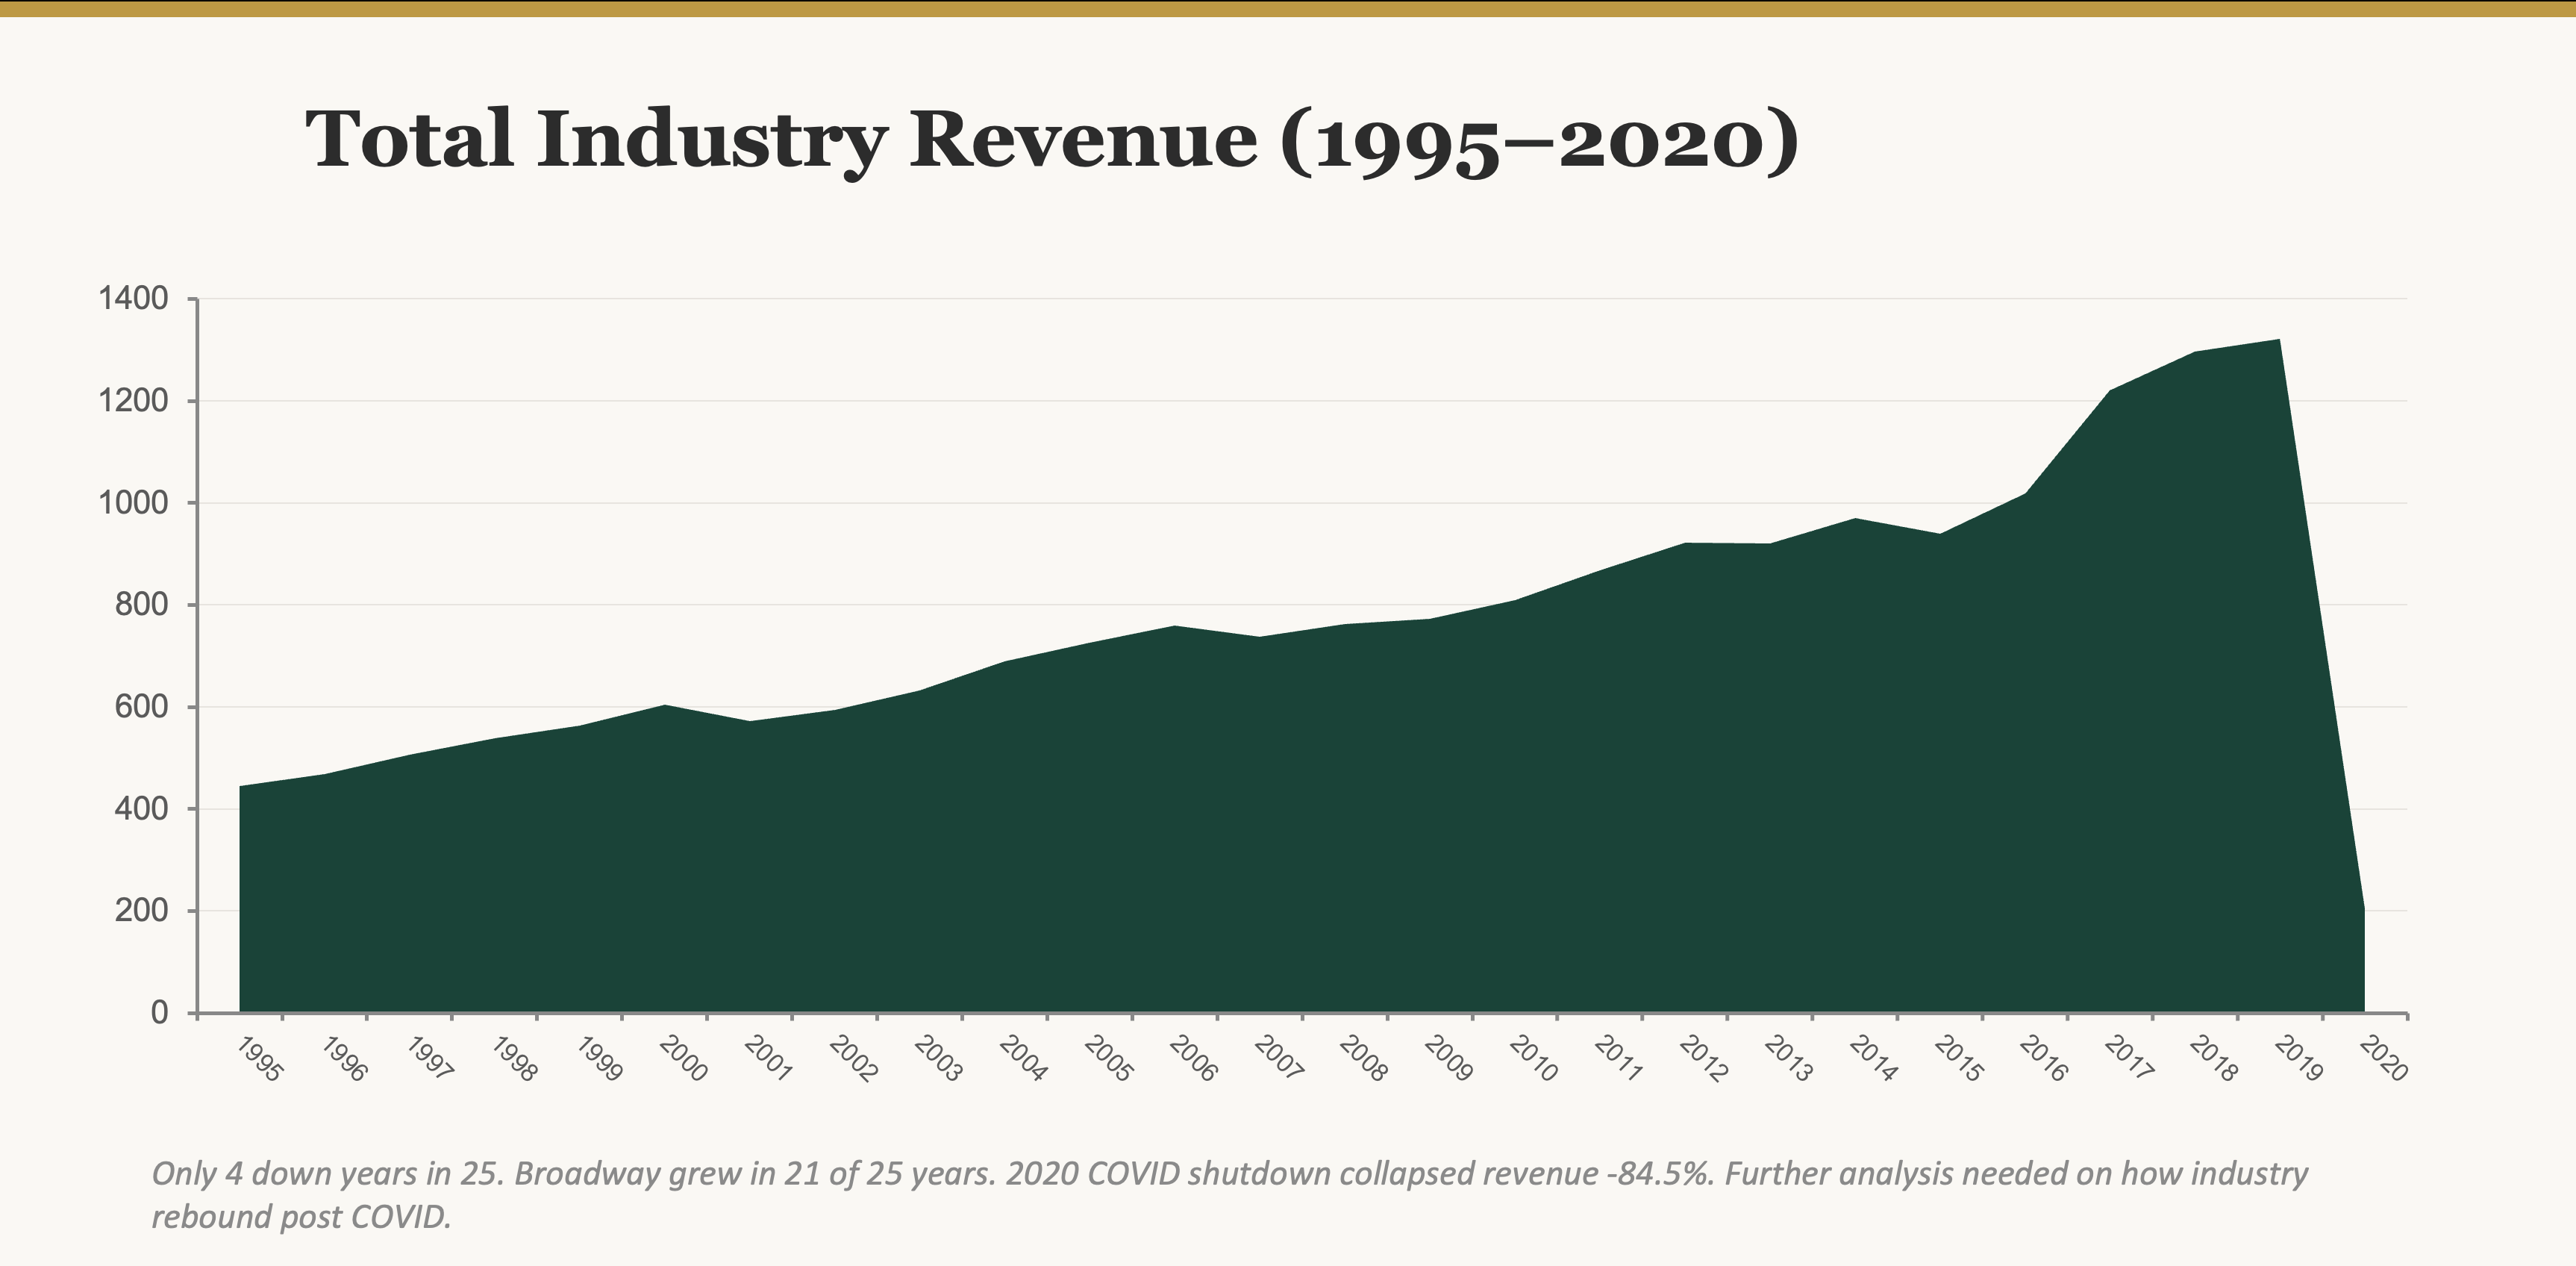
Broadway Market Intelligence
Analyzed 145 productions and 47,500+ weekly records across 25 years to quantify Tony Award marketing ROI (38% revenue lift, p < 0.001), identify longevity predictors, and evaluate production type risk-return profiles. Built a normalized relational database and developed 18 analytical queries with statistical validation.
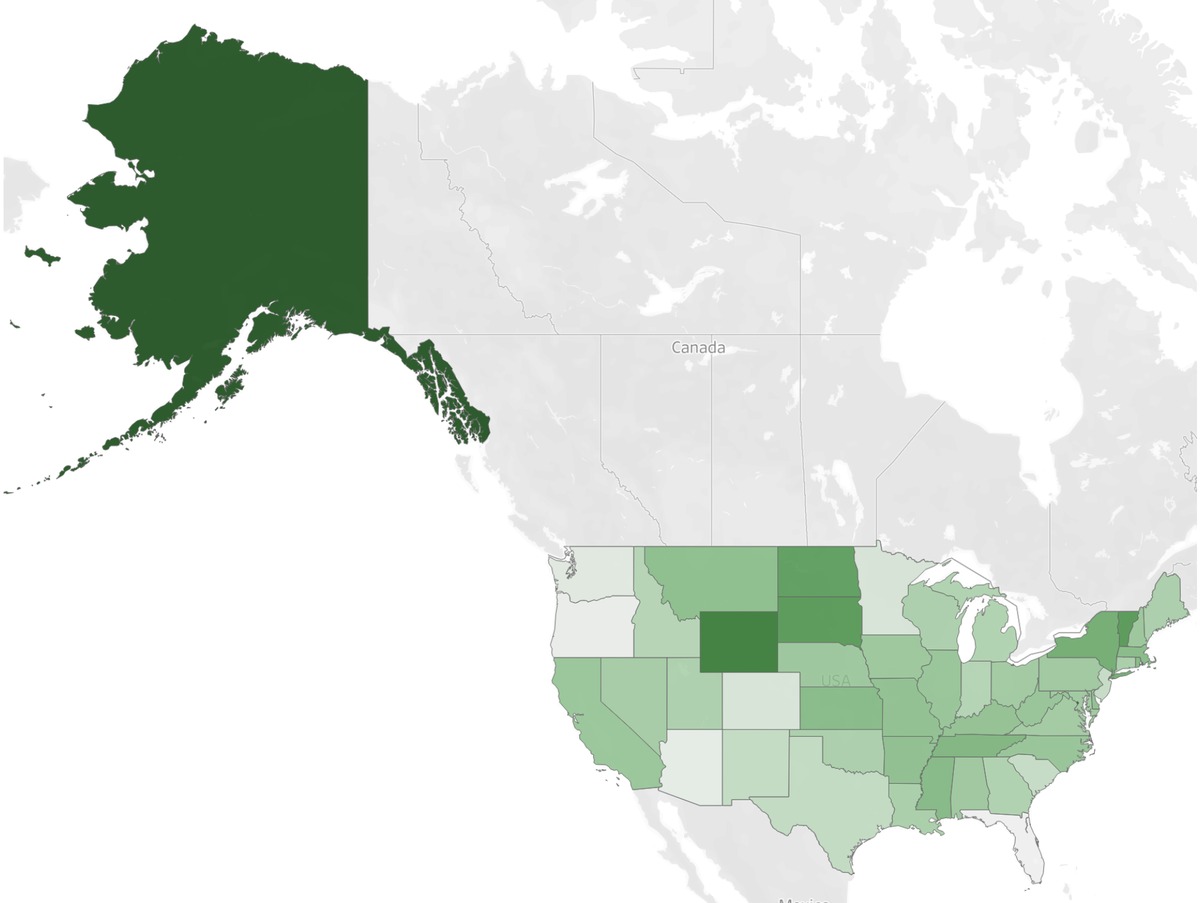
Influenza Staffing Optimization
Forecasted seasonal staffing demand across 50 states using a population-based risk model (R² = 0.88), integrating CDC mortality and demographic data. Delivered a Tableau decision dashboard enabling proactive workforce planning 1–2 months ahead of peak flu season.
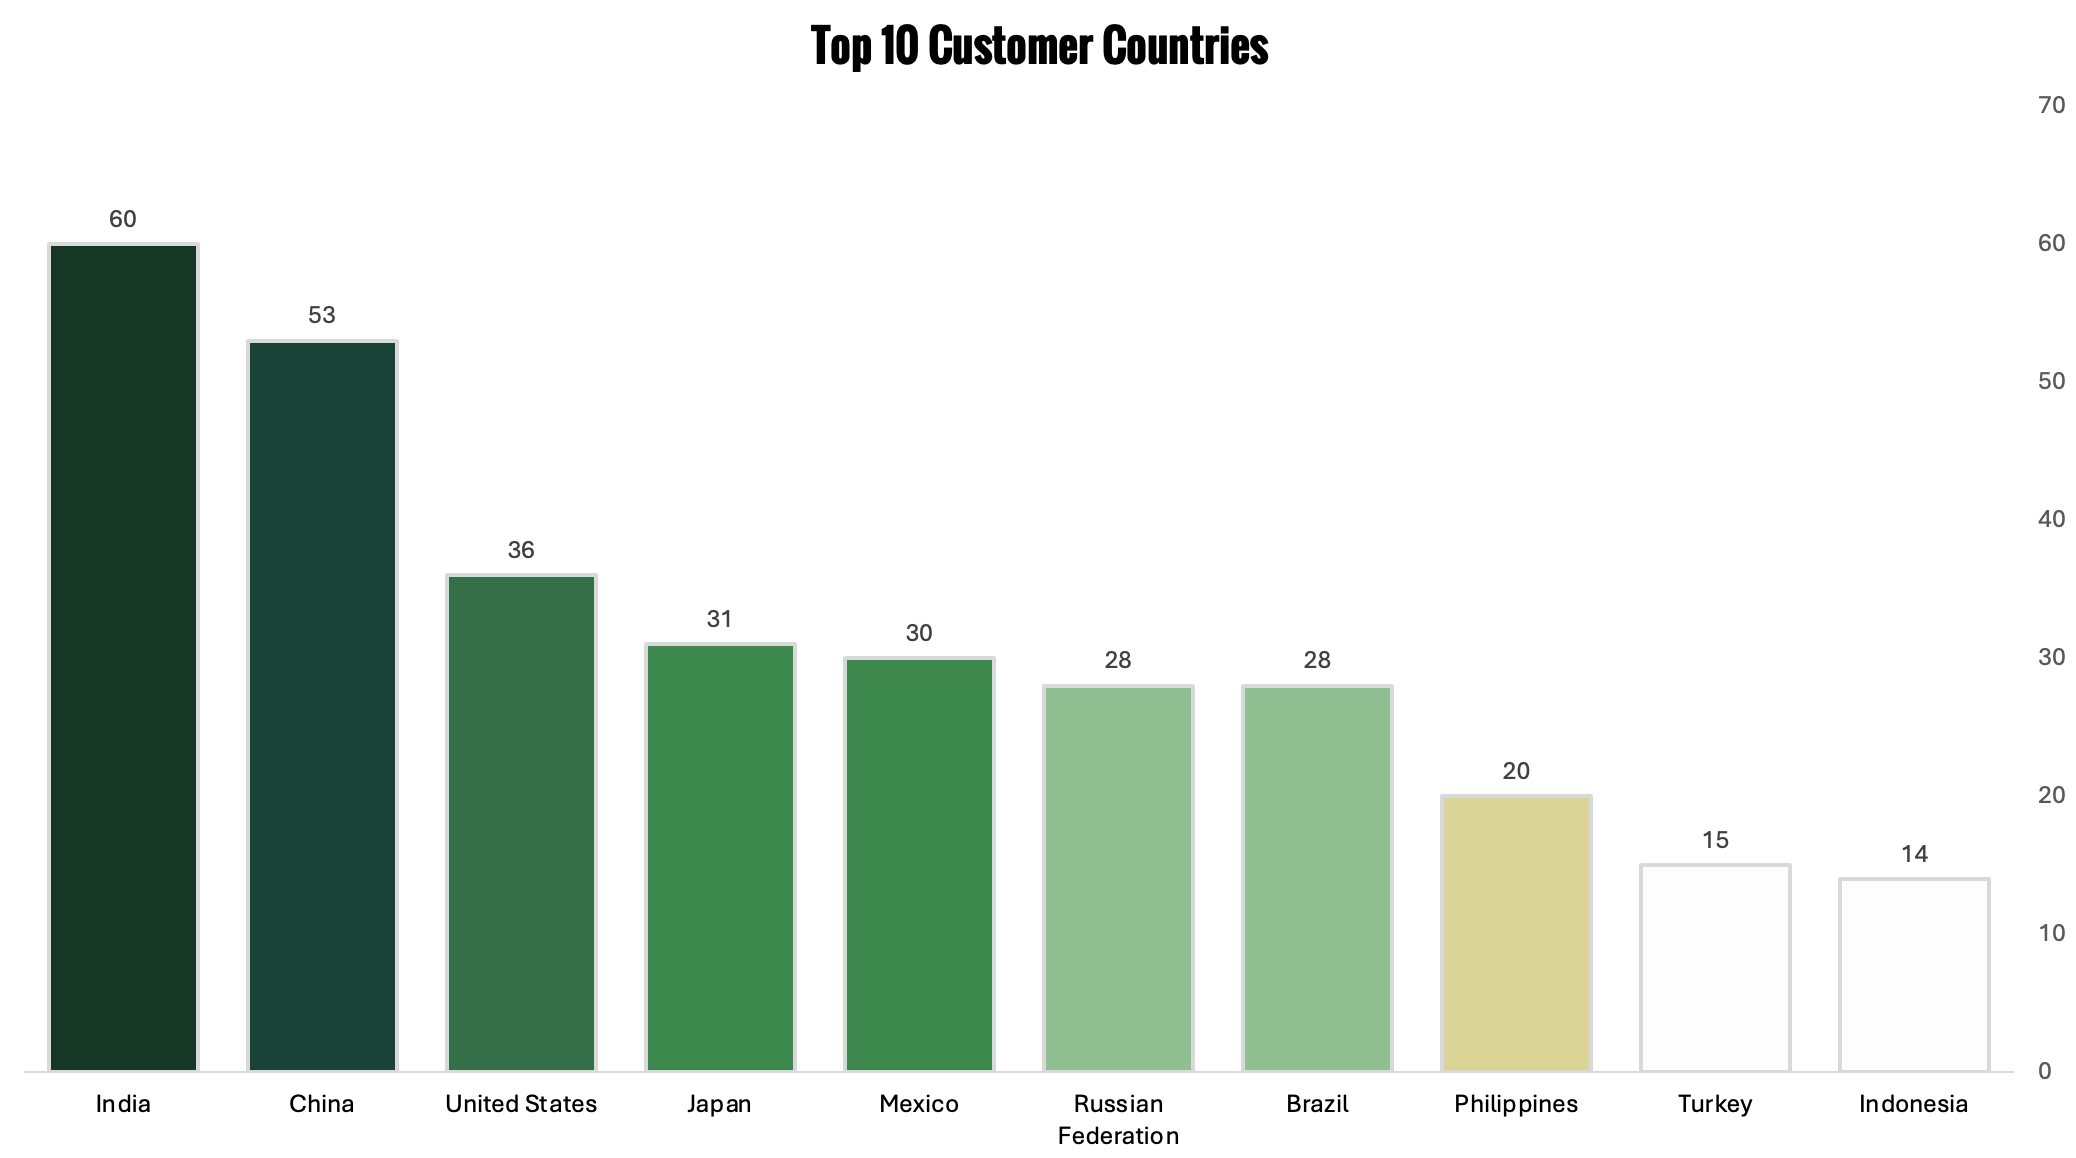
Rockbuster Revenue & Market Analysis
Wrote complex SQL (JOINs, CTEs, window functions) across a 15-table relational database to calculate customer lifetime value and prioritize markets across 108 countries. Developed a phased rollout strategy with Tableau dashboards.
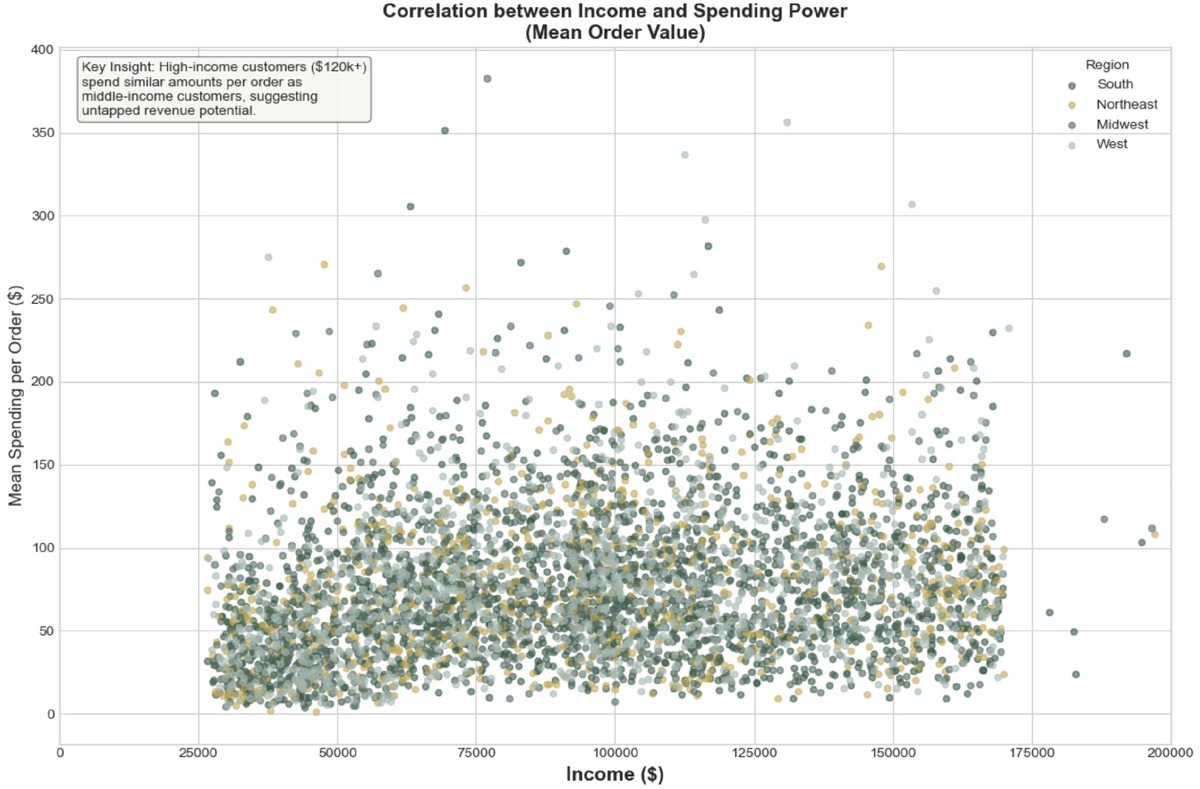
Instacart Customer Segmentation & Revenue Optimization
Cleaned and analyzed 32.4M records across 206K customers to build a segmentation framework identifying high-value personas and revenue patterns. Produced 27 visualizations and marketing recommendations for ad spend optimization, targeting, and cross-sell strategy.
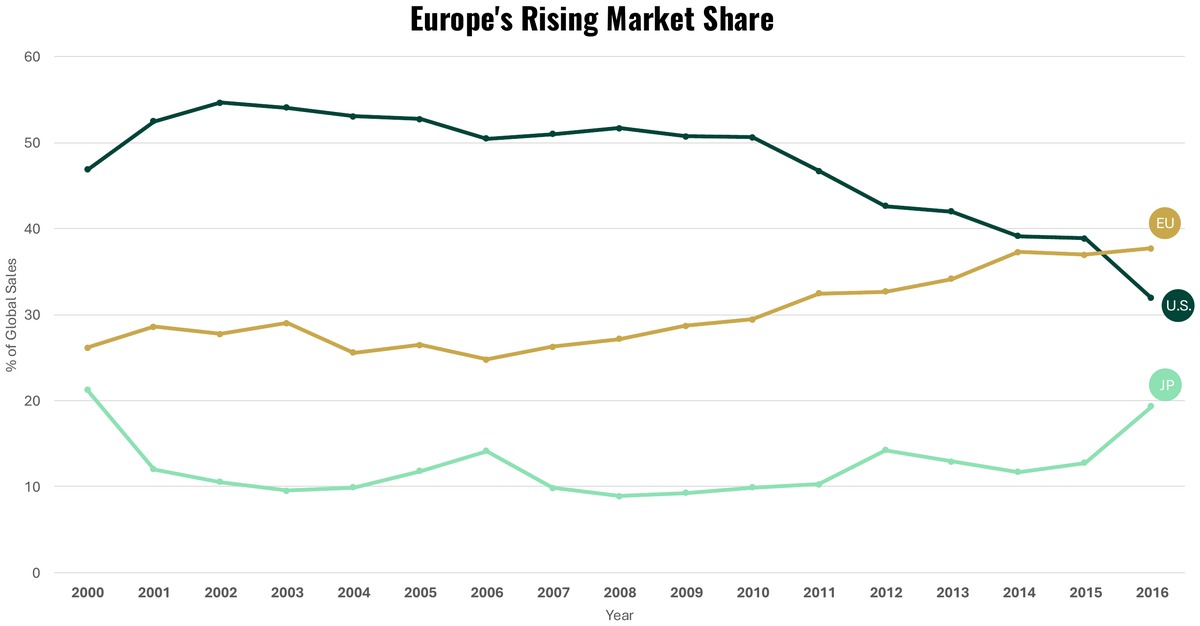
GameCo Global Sales Strategy
Analyzed 16,598 video game titles across global markets to identify regional demand patterns and genre preferences. Discovered Europe overtook North America by 2016 (37.7% vs. 31.9%), enabling data-backed budget allocation recommendations.
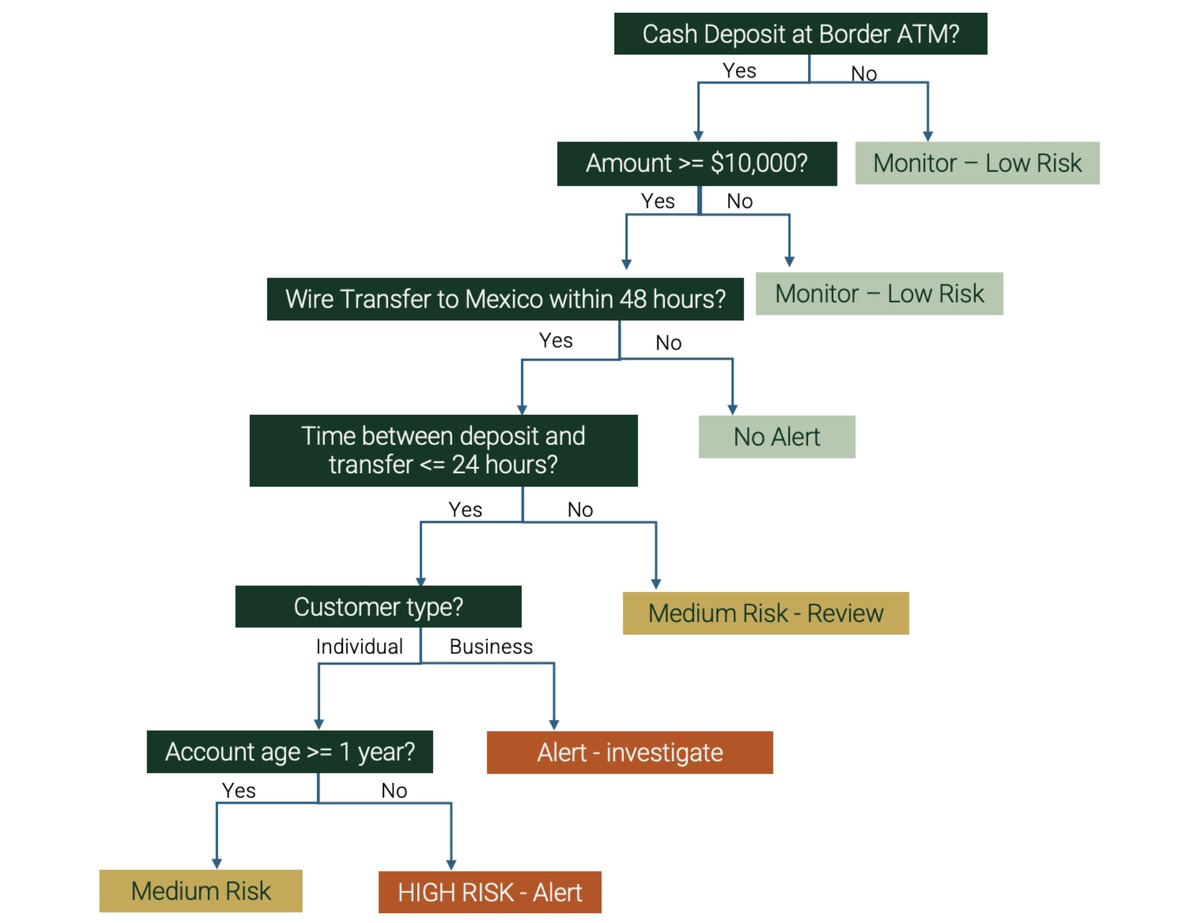
Risk & Responsible Analytics Foundations
Applied analytics for compliance, forecasting, and ethical decision-making. Designed bias-free AML alert logic using behavioral thresholds that removed 6.8x demographic bias. Modeled trends and seasonality for proactive staffing.