Overview
Built a customer analytics framework for Instacart's marketing team, analyzing 32.4M order-product records across 206K customers to identify high-value segments and optimize marketing allocation. The project delivered customer personas, revenue concentration insights, and actionable recommendations for ad spend, targeting, and cross-sell strategy.
Business Problem
Instacart had a large customer base but lacked clarity on which customers drove the most value. Revenue was concentrated in unknown groups, and the marketing team needed data-driven segmentation to allocate spend more effectively and identify growth opportunities.
Business Objectives
- Segment customers by behavior and value
- Identify top revenue personas
- Understand when and what customers buy
- Optimize marketing allocation using data
Data
- 32.4M order-product records
- 206K customers across 3.4M orders
- 5 merged datasets (orders, products, customers, departments, demographics)
Analytical Approach
Data was cleaned and merged using pandas, then analyzed through a customer segmentation framework with behavioral flags and revenue tier concentration analysis. 27 visualizations were produced using matplotlib and seaborn.
Key Findings
Top Insights
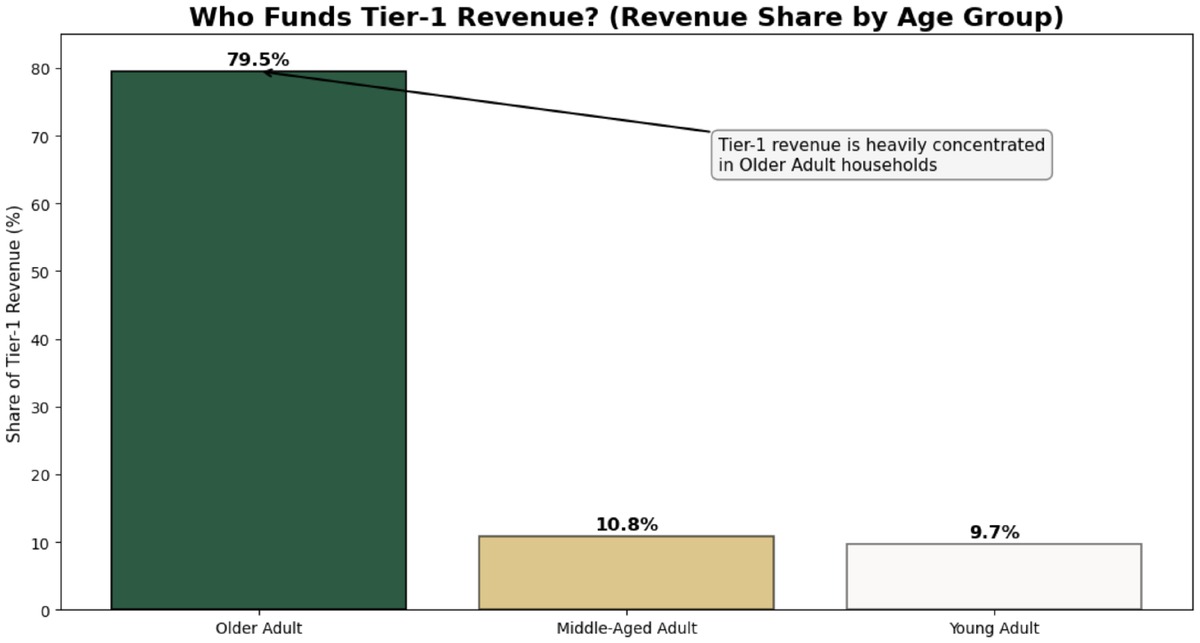
- 56+ adults drive 80% of Tier-1 revenue → primary target segment
- Families generate 87% of order volume → core revenue engine
- Demand peaks 10am–4pm and weekends → optimize ad timing
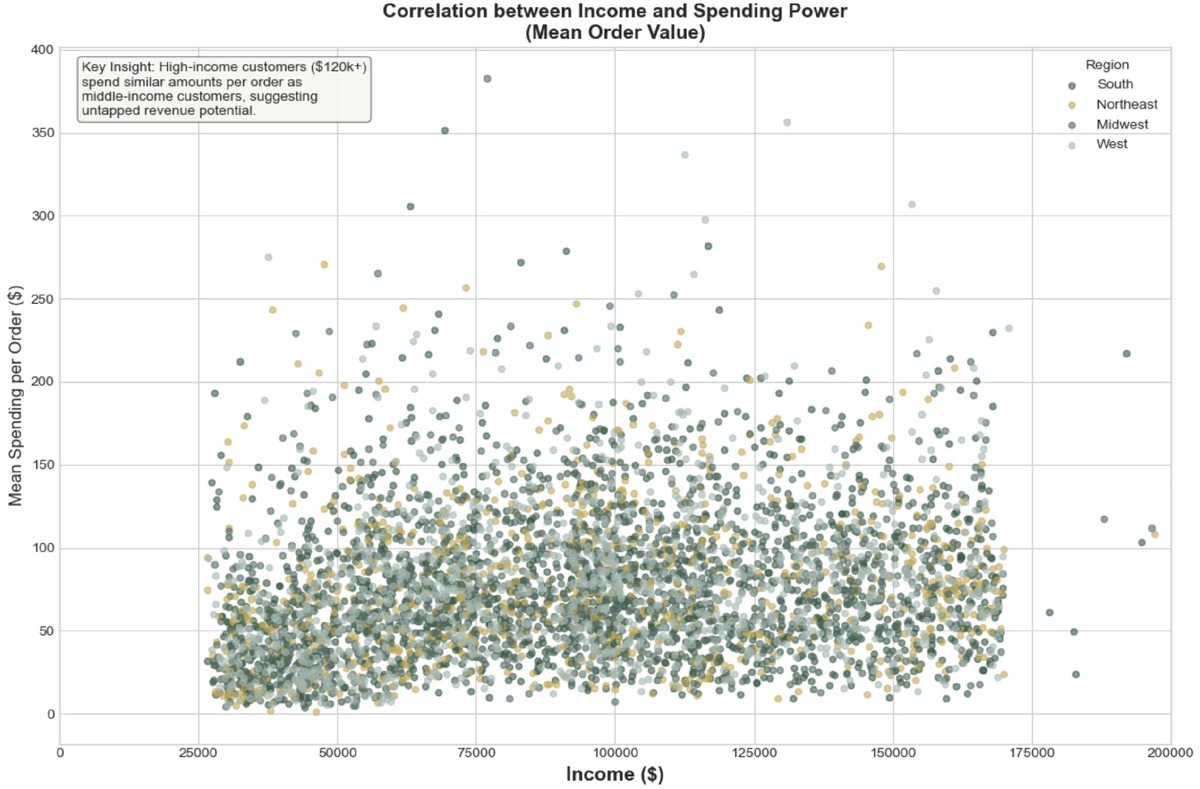
- High-income customers underspend → upsell opportunity
Recommendations
When (Ad Timing)
- Shift ad spend to low-utilization windows (12am–6am Tue–Wed)
- Deploy automated push and discount campaigns
- Reduce spend during already saturated peak periods
Who (Targeting)
- Prioritize family households as core revenue engine
- Target 56+ and health-focused families (highest ROI)
- Upsell high-income customers with bulk and premium offerings
Deliverables
Final Excel report delivered to the client containing all visualizations, analytical breakdowns, key questions answered, and marketing recommendations.
For a full technical breakdown including code, queries, and methodology, view this project on GitHub.
← All Projects