Overview
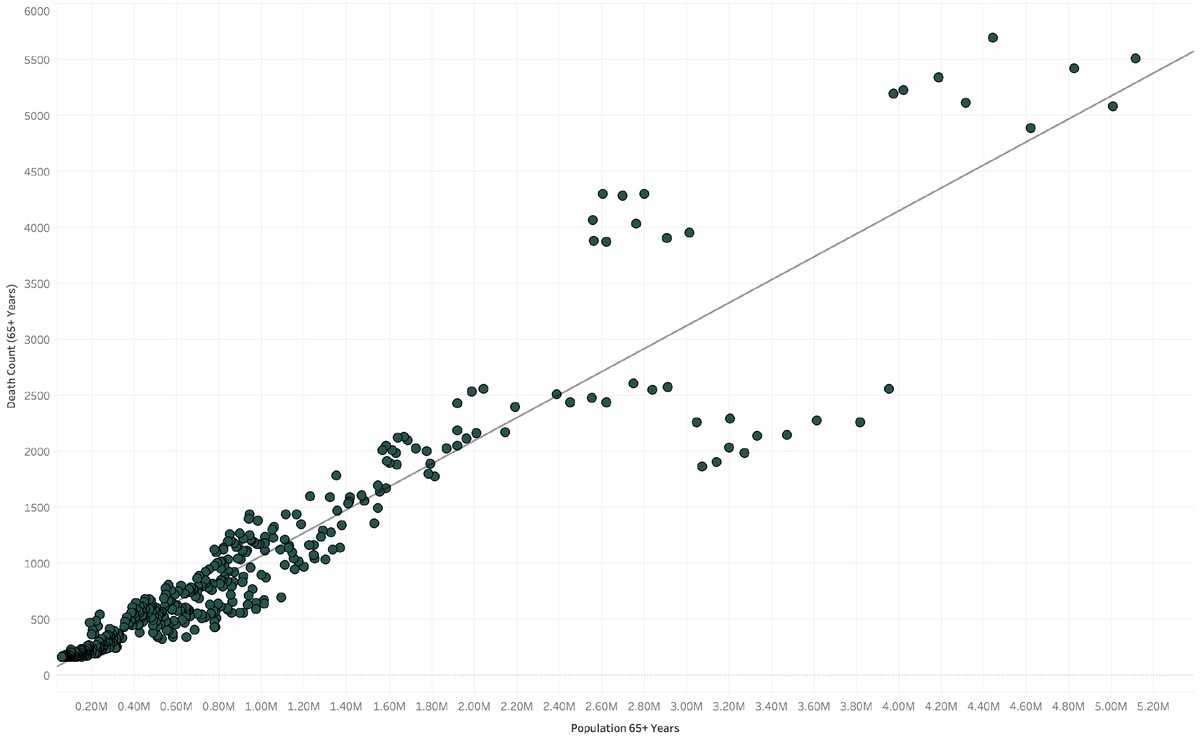
Built a staffing optimization model for healthcare operations leadership, using CDC mortality data and U.S. Census demographics to forecast seasonal flu staffing demand. The population-based risk model (R² = 0.88) enables proactive workforce planning 1–2 months ahead of peak flu season across all 50 states.
Business Problem
Seasonal flu causes unpredictable demand spikes in healthcare facilities. Staffing mismatches increase costs and compromise patient safety, and hospitals often react too late to surges.
Business Objectives
- Identify high-risk states and time periods
- Forecast staffing needs proactively
- Enable data-driven workforce planning
Data Sources
- CDC influenza mortality
- CDC vaccination coverage
- CDC influenza visit trends
- U.S. Census population and age demographics
Analytical Approach
Integrated and cleaned data from multiple CDC and Census sources, calculated per-capita death rates, performed age-based risk segmentation, seasonal trend analysis, and geographic comparisons across all 50 states.
Key Findings
Top Insights
- Elderly population size strongly predicts flu deaths (R² = 0.88)
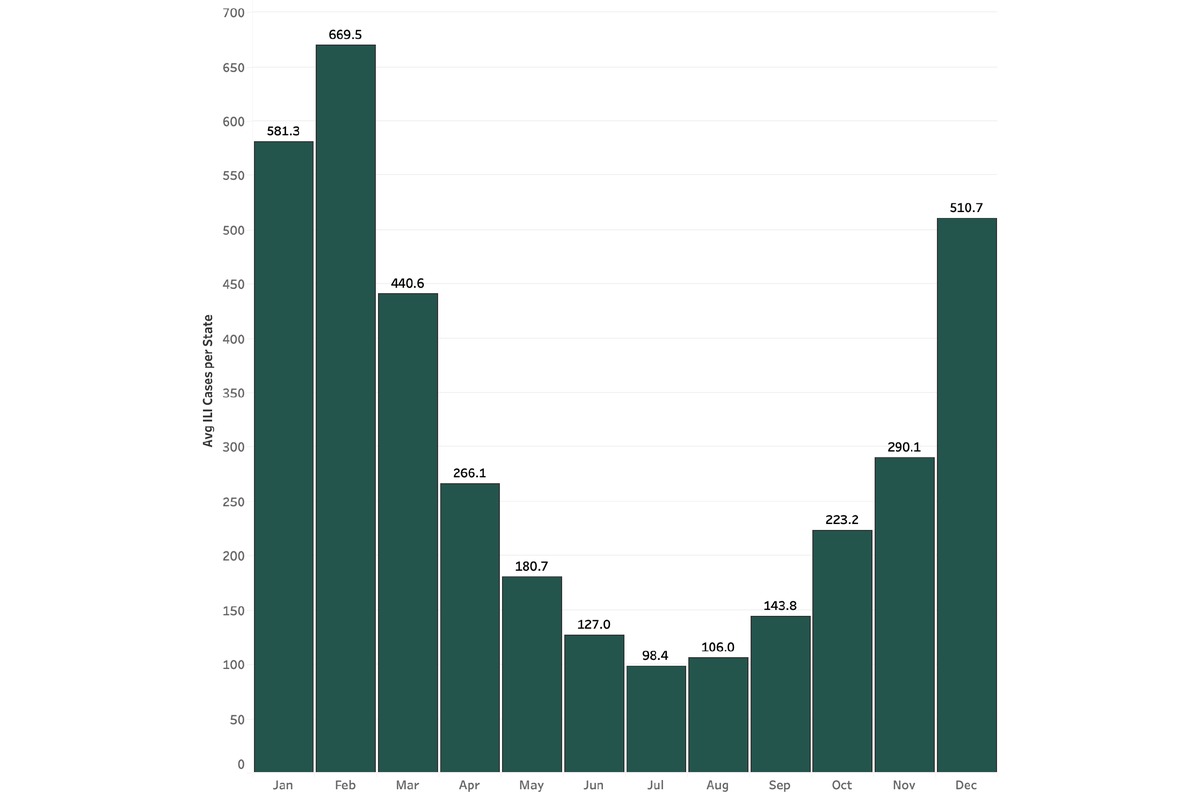
- Winter demand ~5x higher than summer months
- Risk concentrated in Alaska and select Midwest/Northeast states
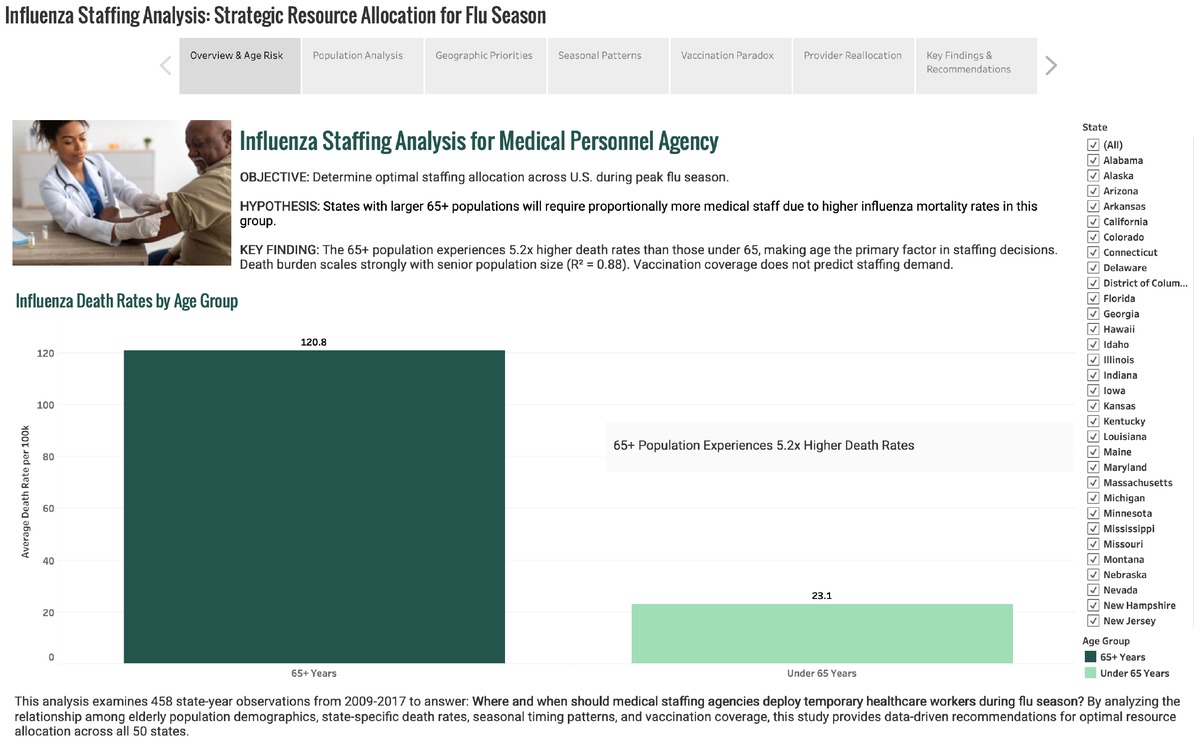
- The 65+ population experiences 5.2x higher death rates
Business Impact
Operational Impact
- Forecast staffing using population-based model (R² = 0.88)
- Prioritize senior-heavy states with ~5x higher mortality risk
- Plan schedules 1–2 months ahead instead of reactive hiring
Cost & Patient Impact
- Reduce summer overstaffing through seasonal reallocation
- Avoid emergency surge hiring by planning for winter demand spikes
- Improve care outcomes for 65+ populations in high-risk regions
Deliverables
For a full technical breakdown including code, queries, and methodology, view this project on GitHub.