Overview
Designed and analyzed a normalized relational database in PostgreSQL to identify the financial and operational drivers of commercial success across 145 Broadway productions and 47,500+ weekly performance records (1995–2020). The analysis quantified Tony Award marketing ROI, identified longevity predictors, evaluated launch timing effects, and built a production type risk-return framework. This project is framed as strategic intelligence for The Broadway League.
Business Problem
Broadway producers and theater owners invest millions in productions with limited data-driven guidance on what predicts commercial success. The Broadway League needed actionable intelligence to help stakeholders make informed decisions about production development, marketing investment, and long-term sustainability planning.
Business Objectives
- Quantify the marketing ROI of Tony Award wins
- Identify predictors of long-running commercial viability
- Evaluate production type risk-return profiles
- Determine optimal launch timing strategy
Data
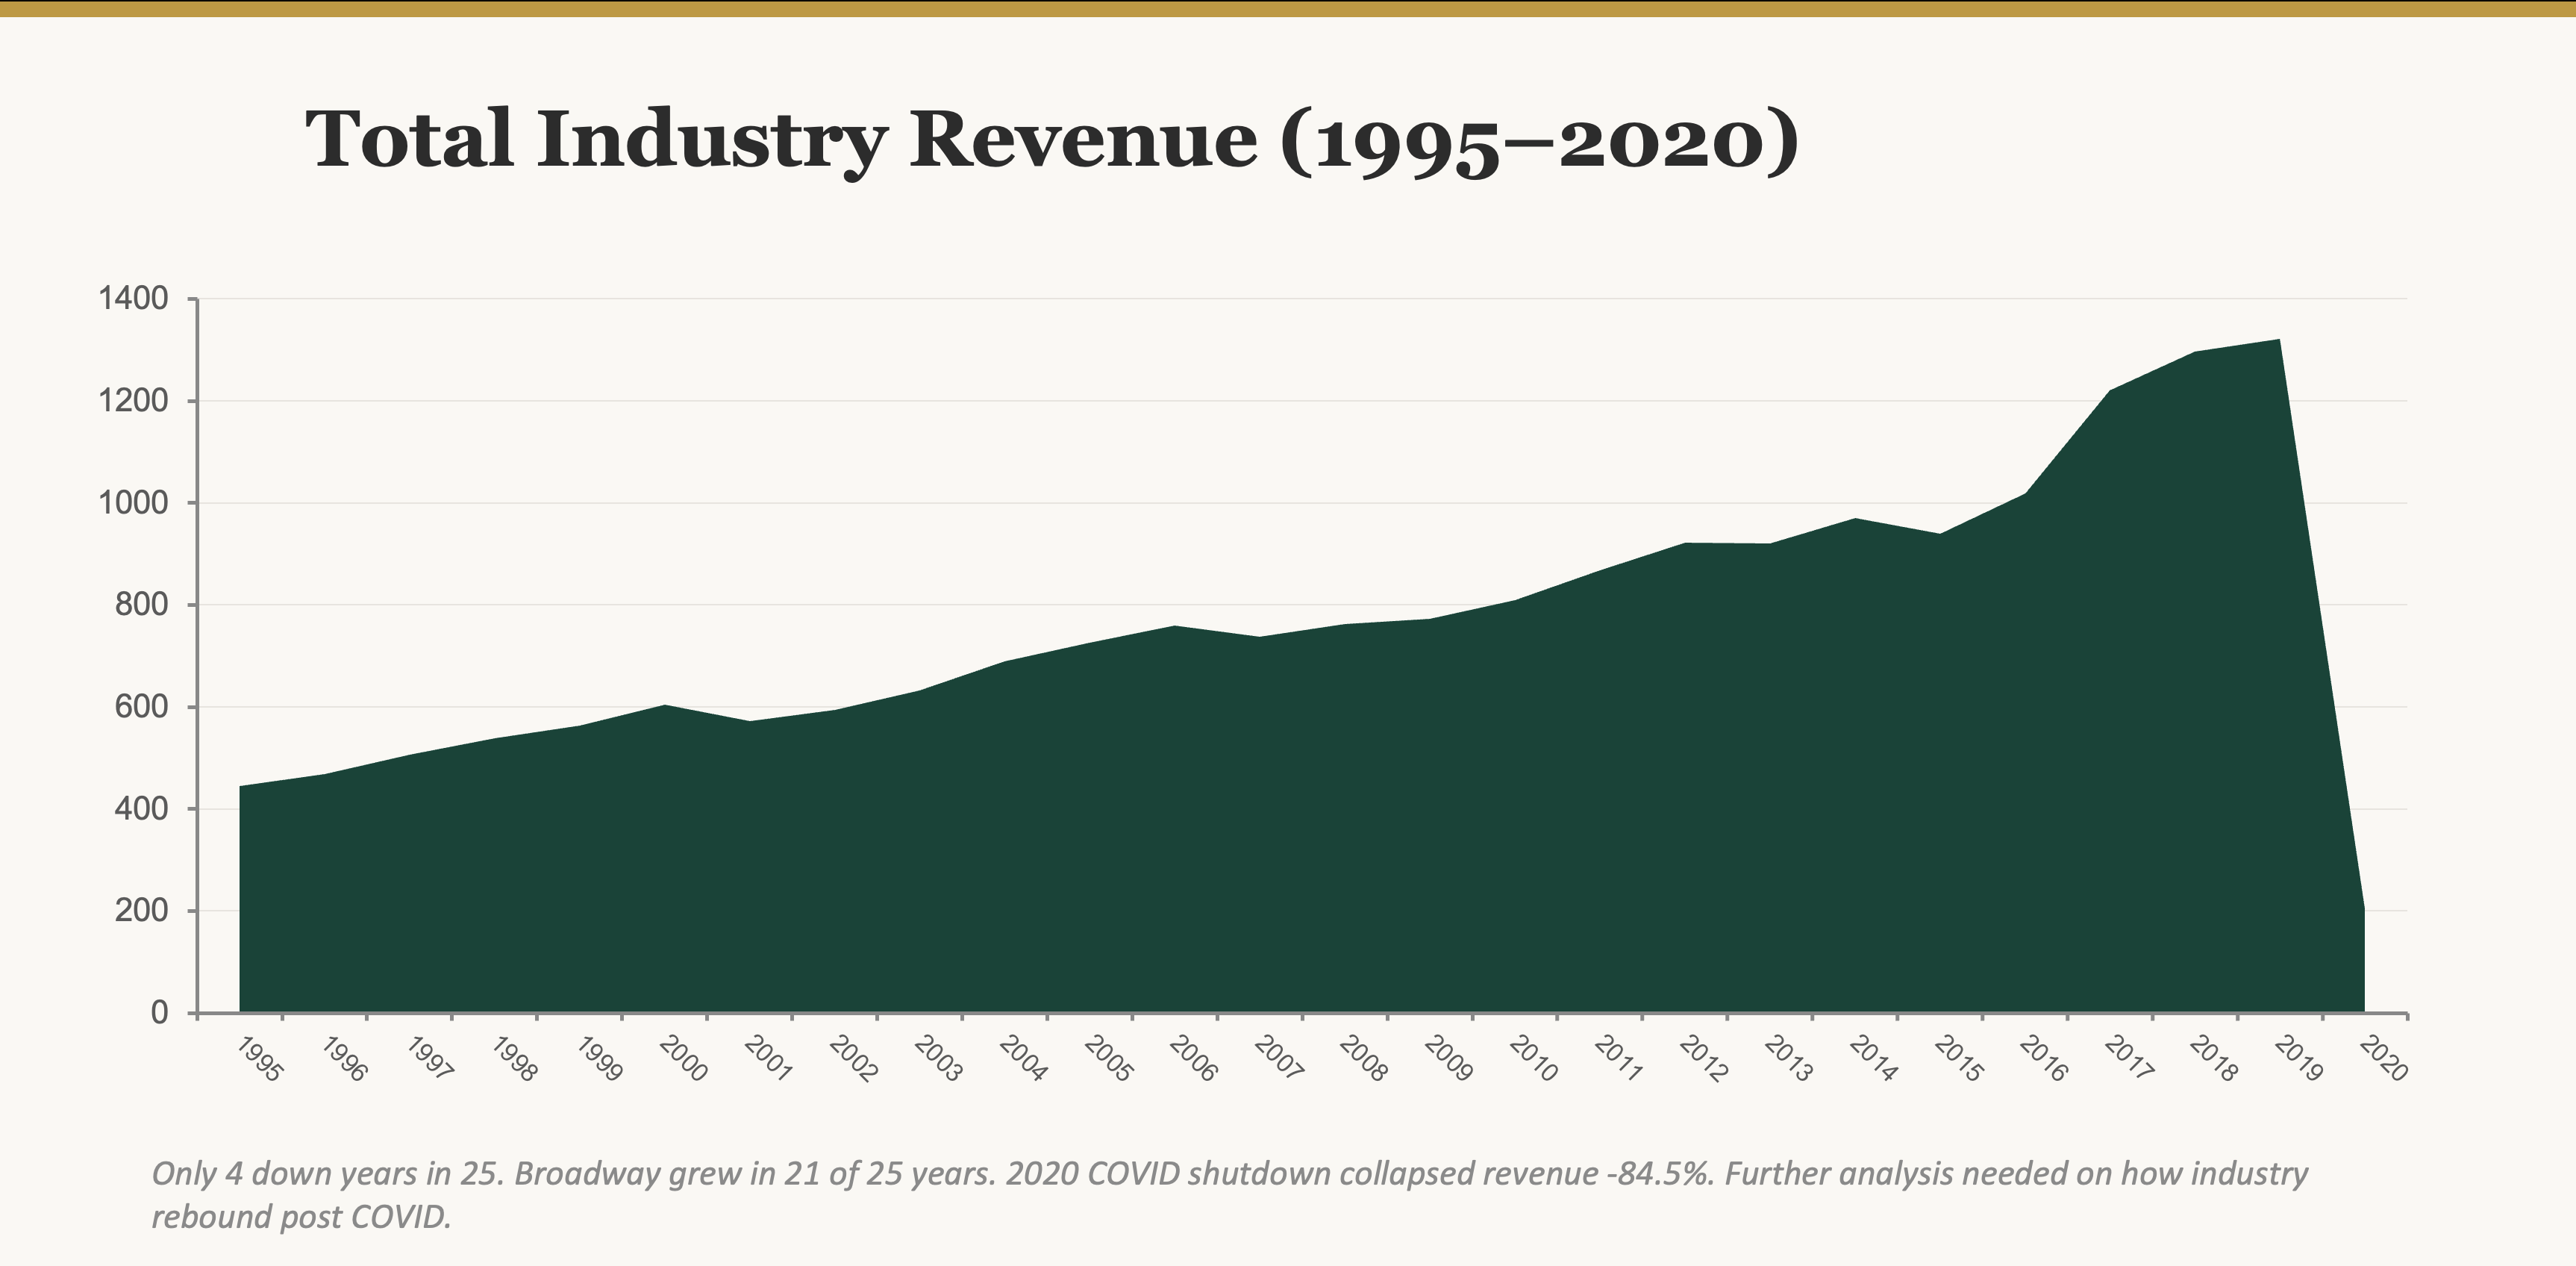
- 47,524 weekly box office records (1995–2020)
- 145 productions classified by type and category
- 33 Tony Award winners (Best Musical & Best Play)
- 3-table normalized relational schema
Analytical Approach
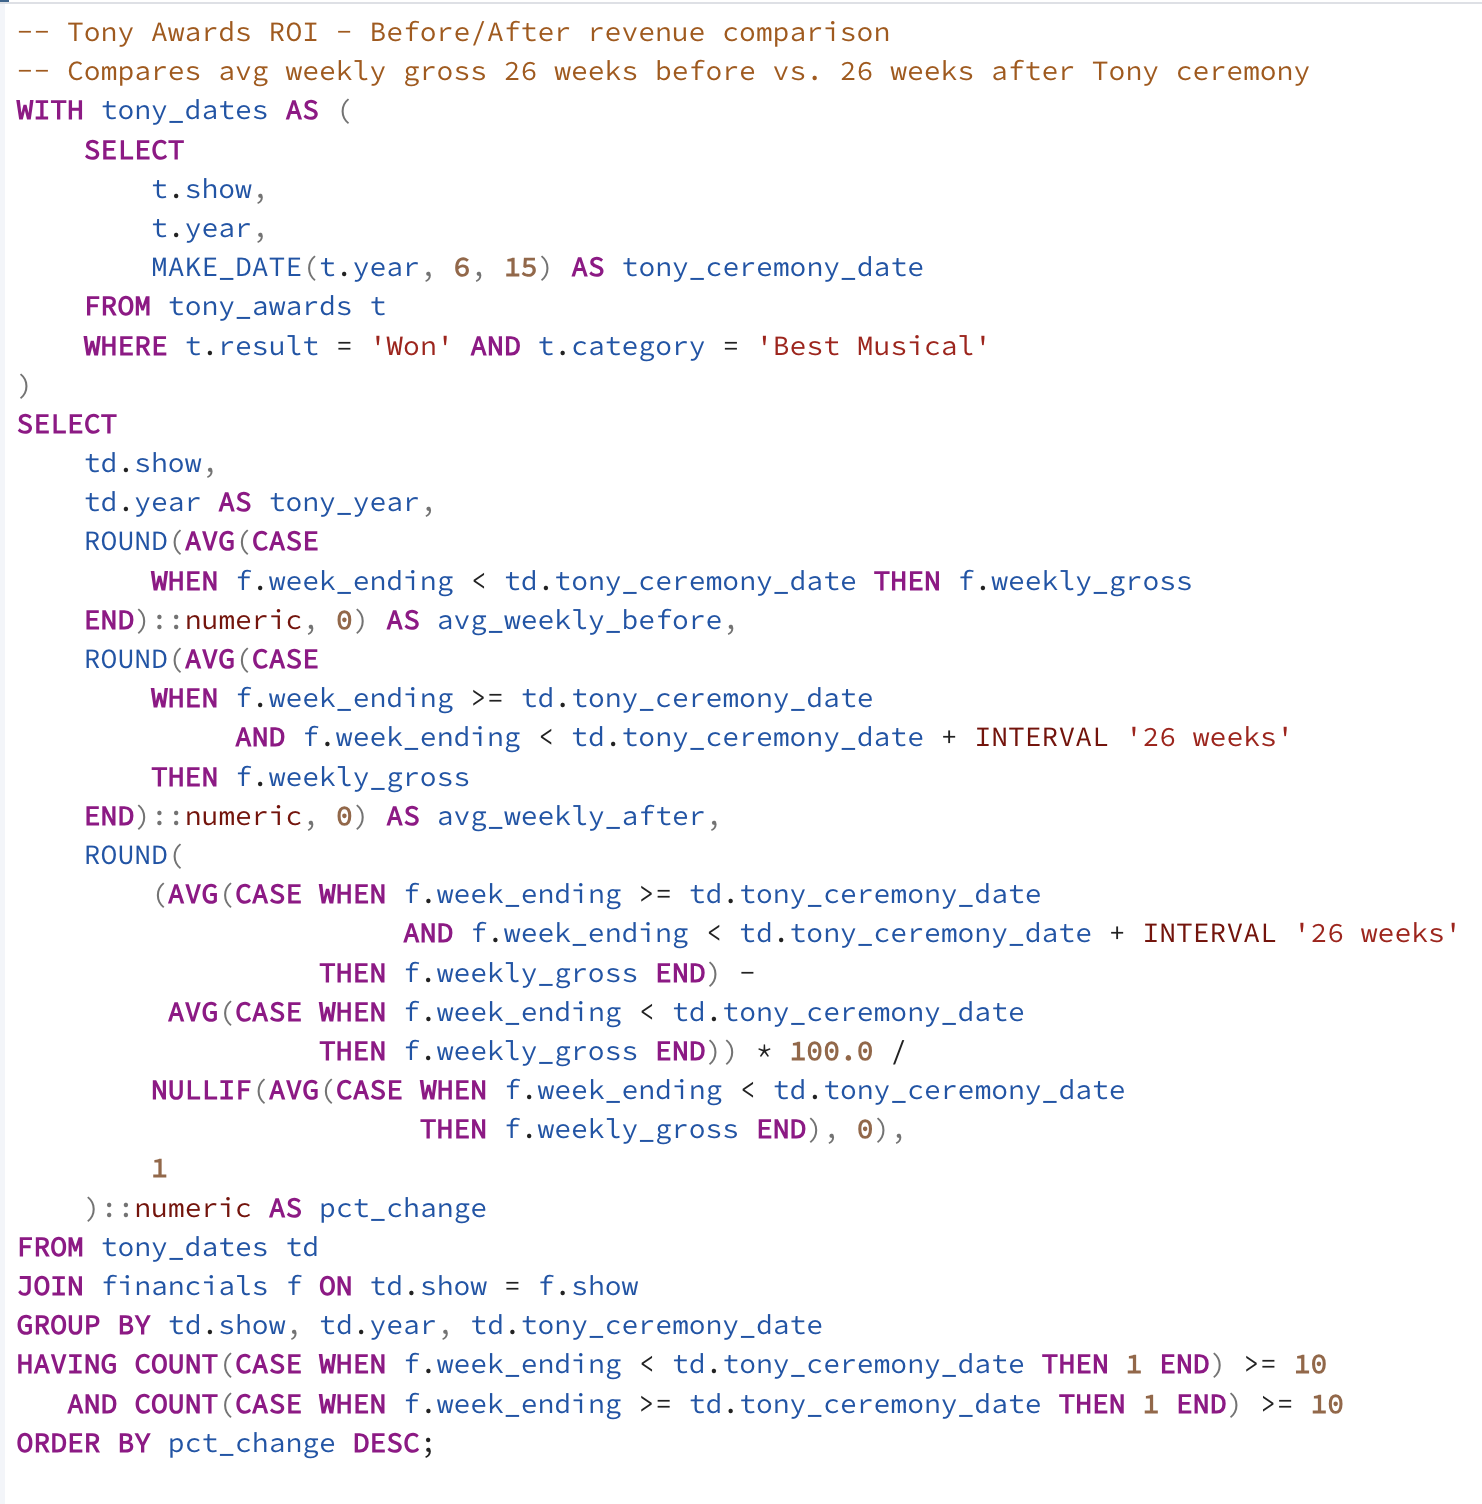
Built a 3-table normalized schema (shows, financials, tony_awards) in PostgreSQL and developed 18 analytical queries using CTEs, window functions (LAG, ROW_NUMBER), multi-table JOINs, CASE statements, and date arithmetic. Show metadata for all 145 productions was manually researched and classified using IBDB.com and Wikipedia. Statistical validation was performed using paired t-tests and Wilcoxon signed-rank tests in Python.
Key Findings
Top Insights
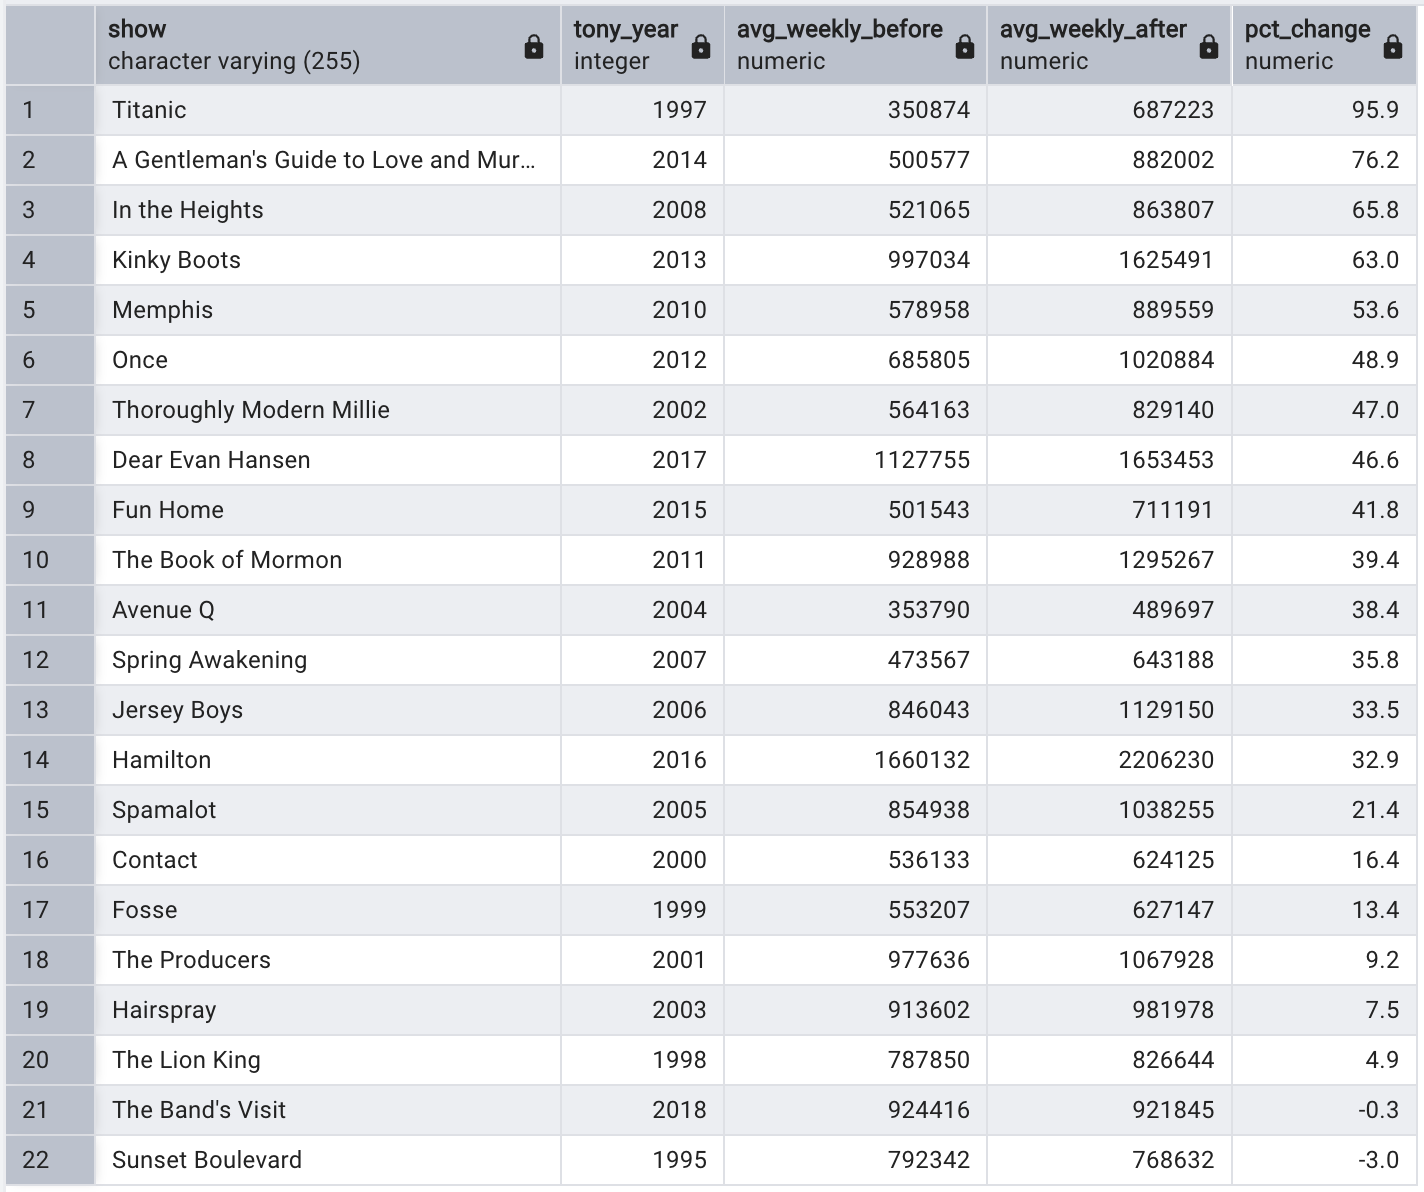
- Tony Award winners experience a 38% avg revenue lift post-ceremony (p < 0.001)
- Fall launches earn nearly 2x spring openings ($218M vs. $116M avg gross)
- Sustained 82%+ capacity is the strongest predictor of 10+ year runs
- Ticket prices tripled ($42→$125) without suppressing demand
Business Impact
Marketing Strategy
- 38% post-award lift justifies Tony campaign investment
- Shows with moderate pre-award revenue gain the most from a win
- Autumn openings build momentum through holiday season into Tony eligibility
Production Planning
- Capacity above 82% signals long-term viability — use as leading indicator
- Original works win Tonys at 3–10x the rate of revivals
- Balanced pipeline should mix originals with lower-risk adaptations
Statistical validation (paired t-test, p < 0.001; Wilcoxon signed-rank, p < 0.001) confirms the Tony Award revenue lift is not attributable to chance. The 95% confidence interval for the mean weekly increase is $162,946 to $323,638.
For a full technical breakdown including code, queries, and methodology, view this project on GitHub.
← All Projects