Overview
NYC invests billions in healthcare infrastructure, yet health outcomes vary dramatically by neighborhood. This analysis tested a common assumption that more facilities lead to better outcomes, using data across 2,368 census tracts in all five boroughs. By combining CDC health data, U.S. Census demographics, and NYC facility records, it revealed that income, not access, drives disparities and segmented neighborhoods into four actionable health profiles. The findings guided targeted recommendations: where to invest (South Bronx and Central Brooklyn), how to invest (barrier reduction over facility expansion), and when to act (before economic shocks compound existing vulnerabilities).
Business Problem
NYC Department of Health leadership, community health organizations, and hospital network administrators needed data-driven answers to guide resource allocation, but lacked neighborhood-level segmentation to make targeted decisions.
Business Objectives
- Identify primary drivers of health outcome disparities across NYC neighborhoods
- Test whether healthcare facility access improves health outcomes
- Segment neighborhoods into actionable health profiles for targeted investment
- Provide data-driven recommendations for resource allocation
Data Sources
- CDC PLACES (2020–2024 releases)
- U.S. Census American Community Survey
- NYC Open Data Health Facility Dataset
- FRED NYC Unemployment Rate
- 2,368 census tracts · 10,699 observations · 2018–2022
Key Findings
Top Insights
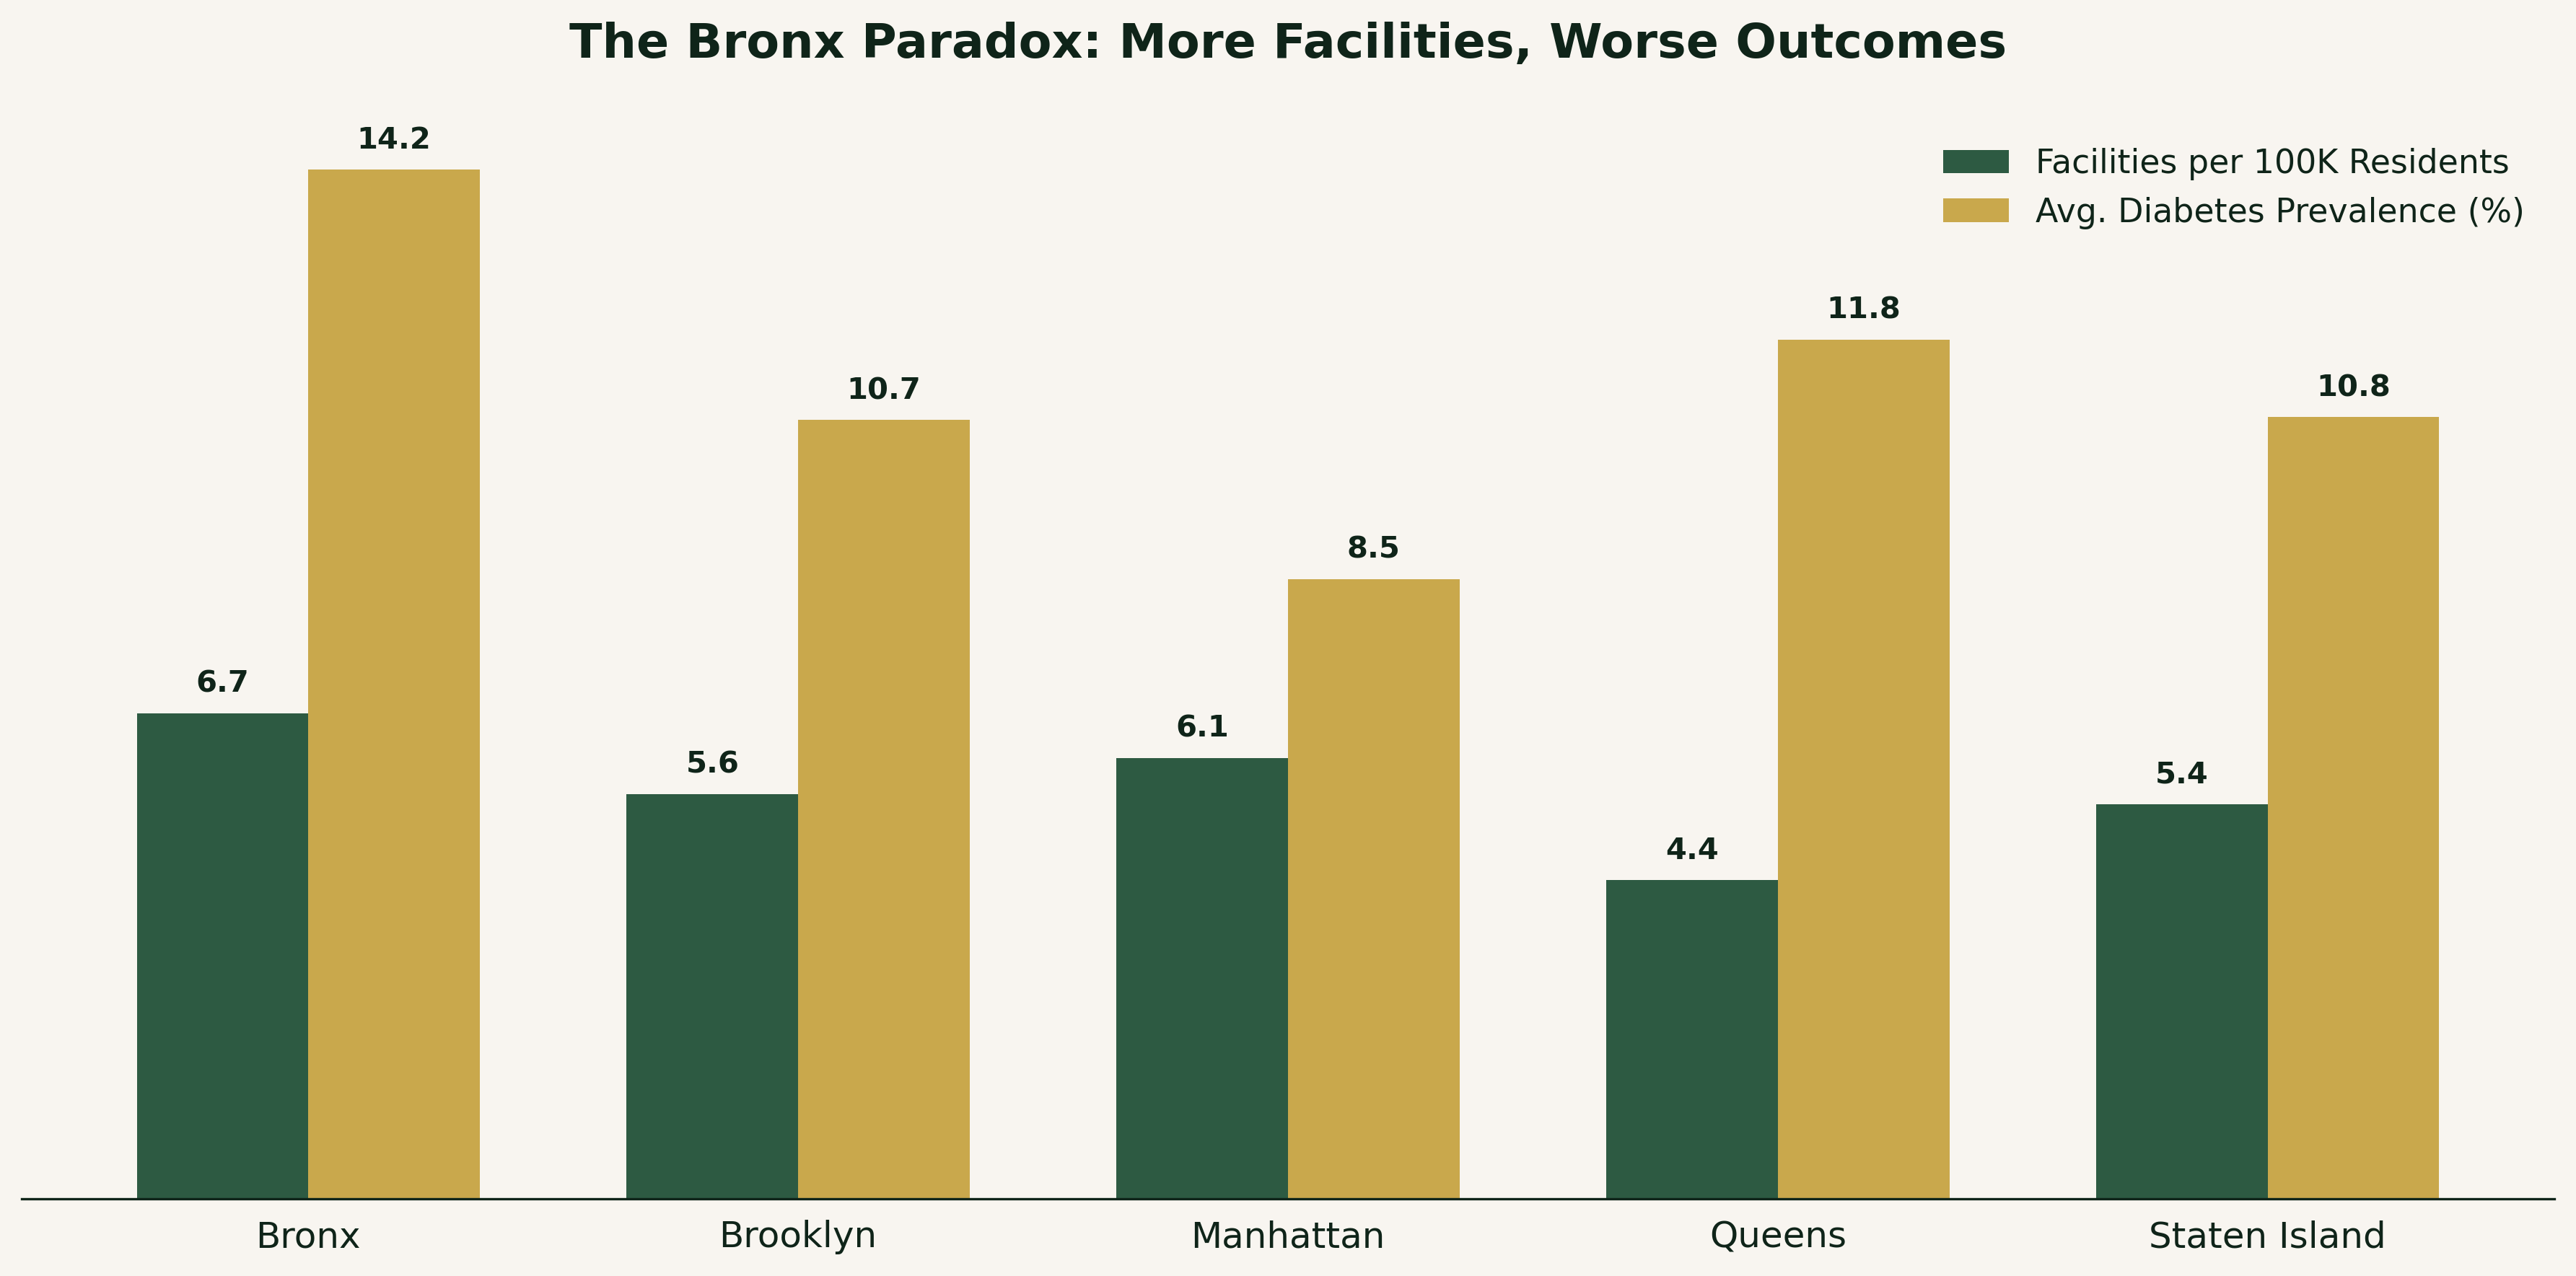
- The Bronx has the most facilities per capita (6.7 per 100K) and the worst diabetes rate (14.2%) → income drives outcomes, not access
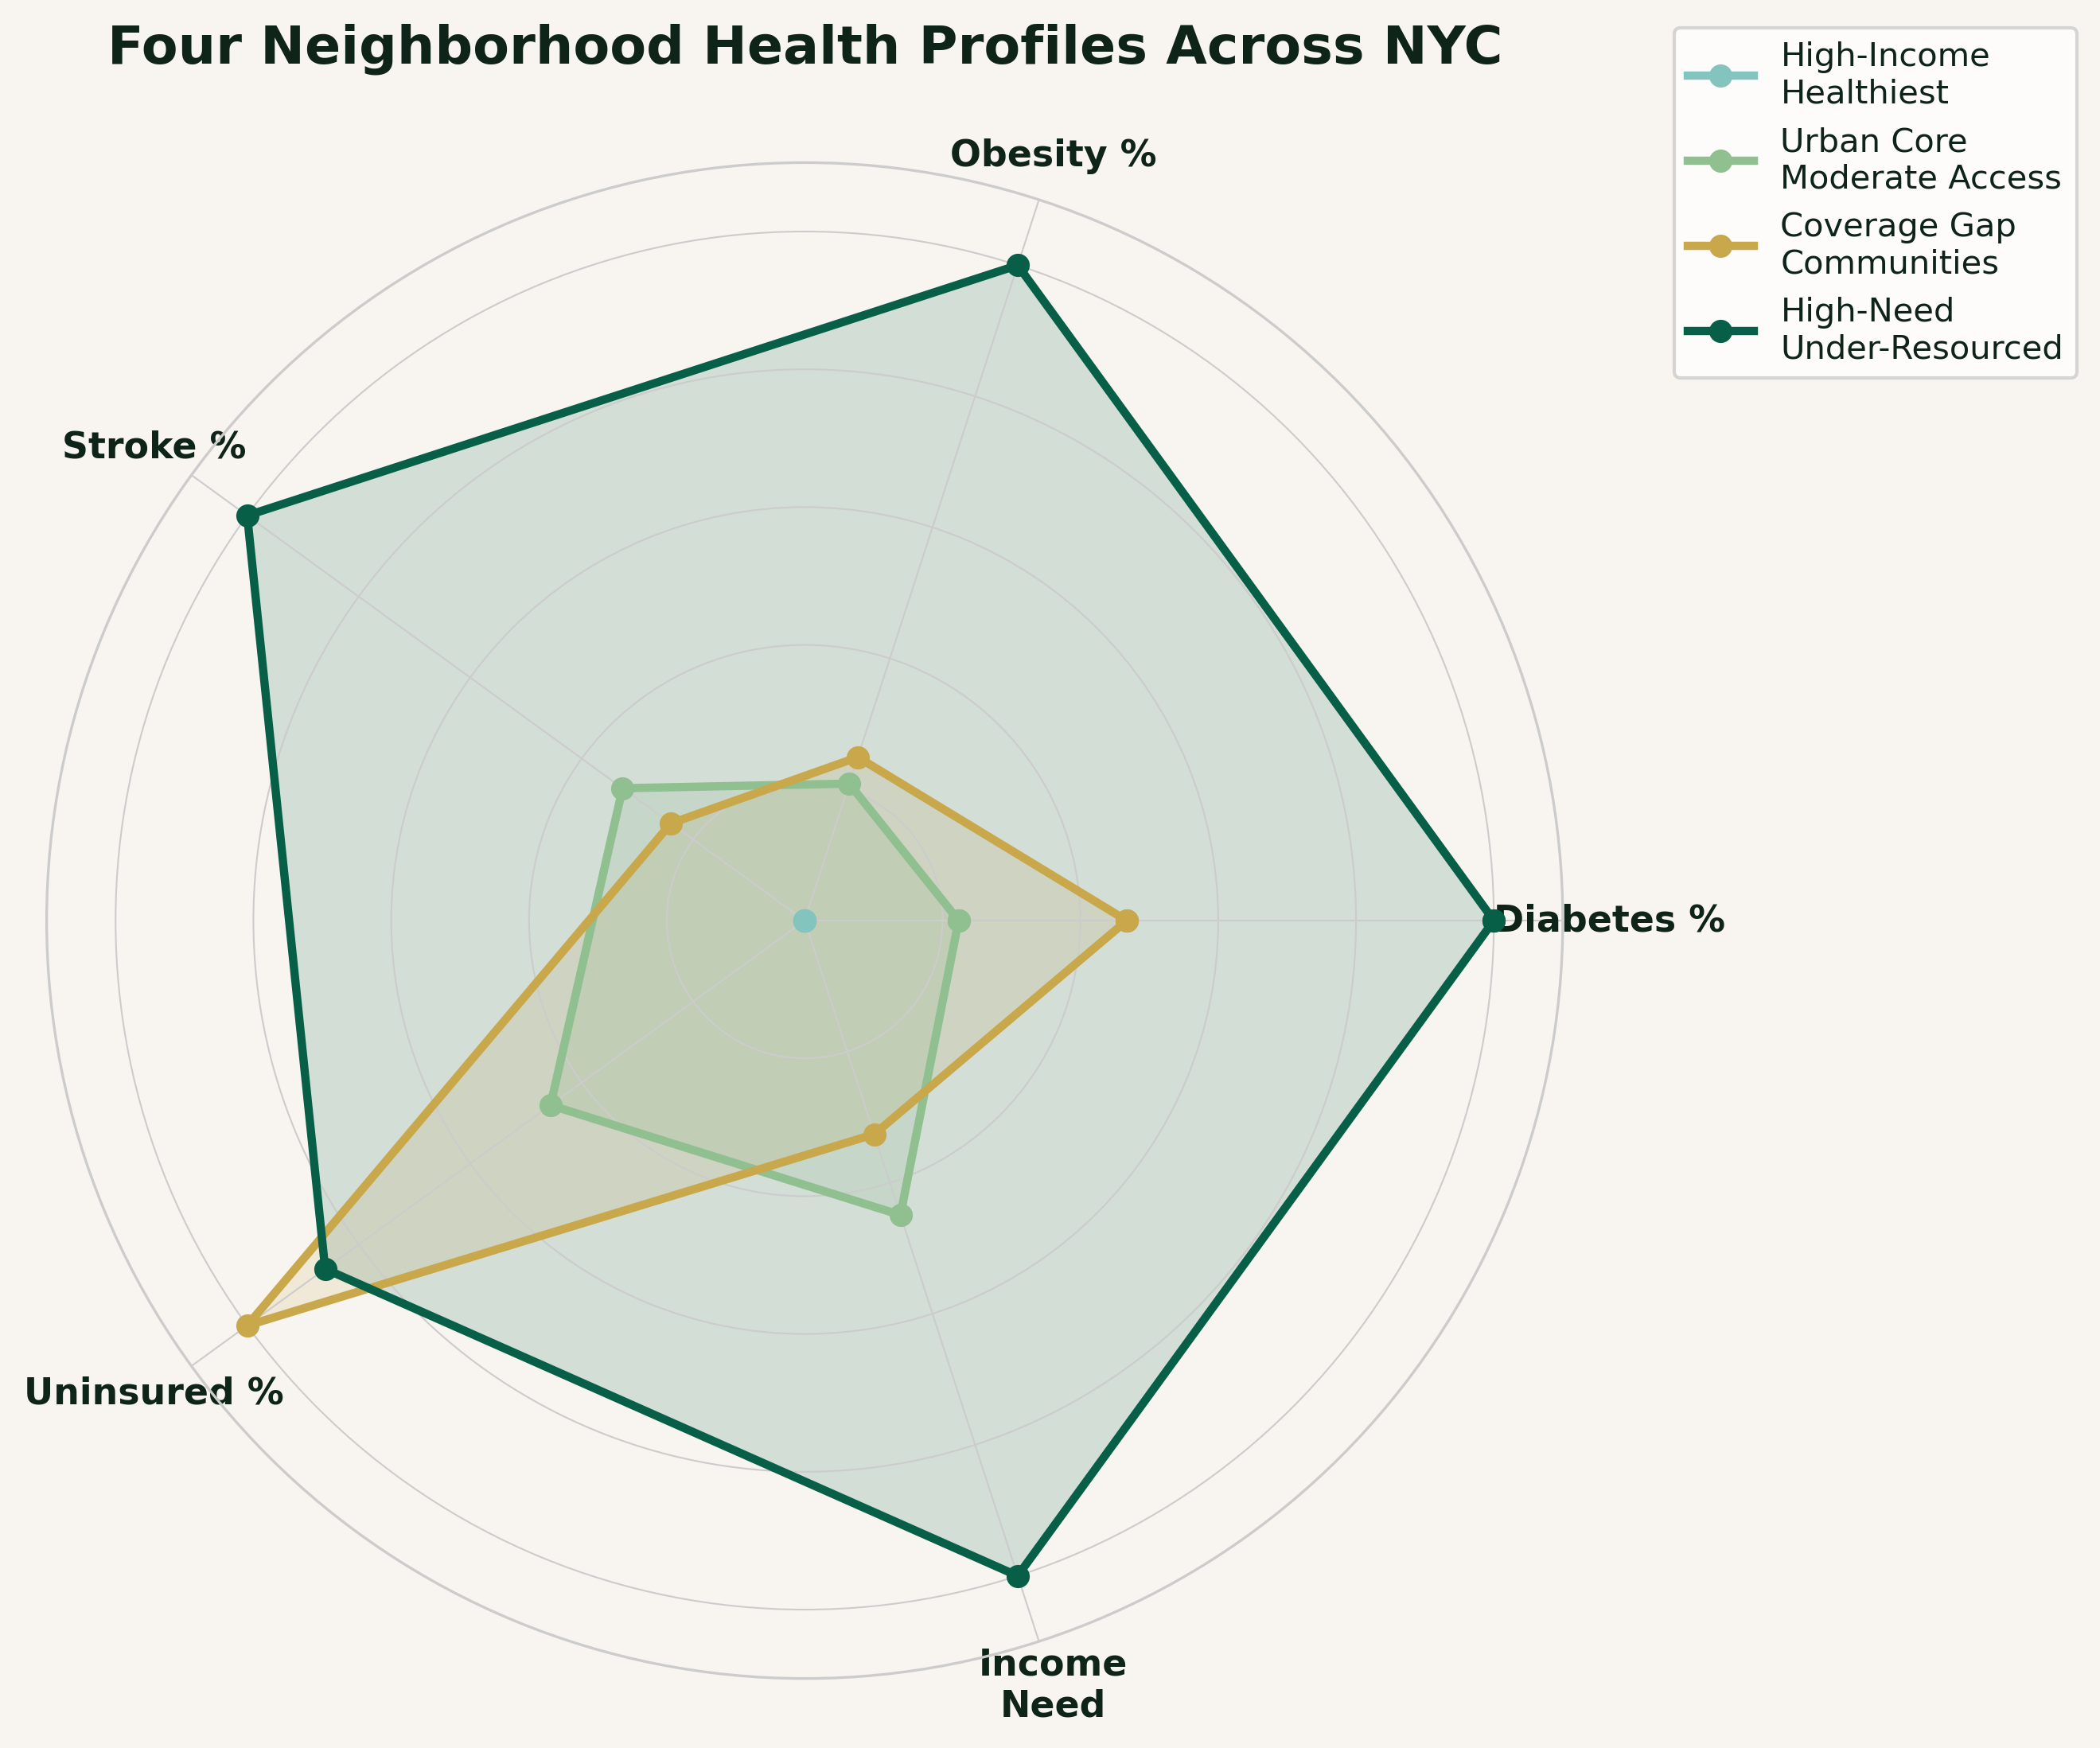
- Four neighborhood profiles identified: healthiest ($102K income, 9% diabetes) to most vulnerable ($53K income, 14.8% diabetes) → clear income gradient
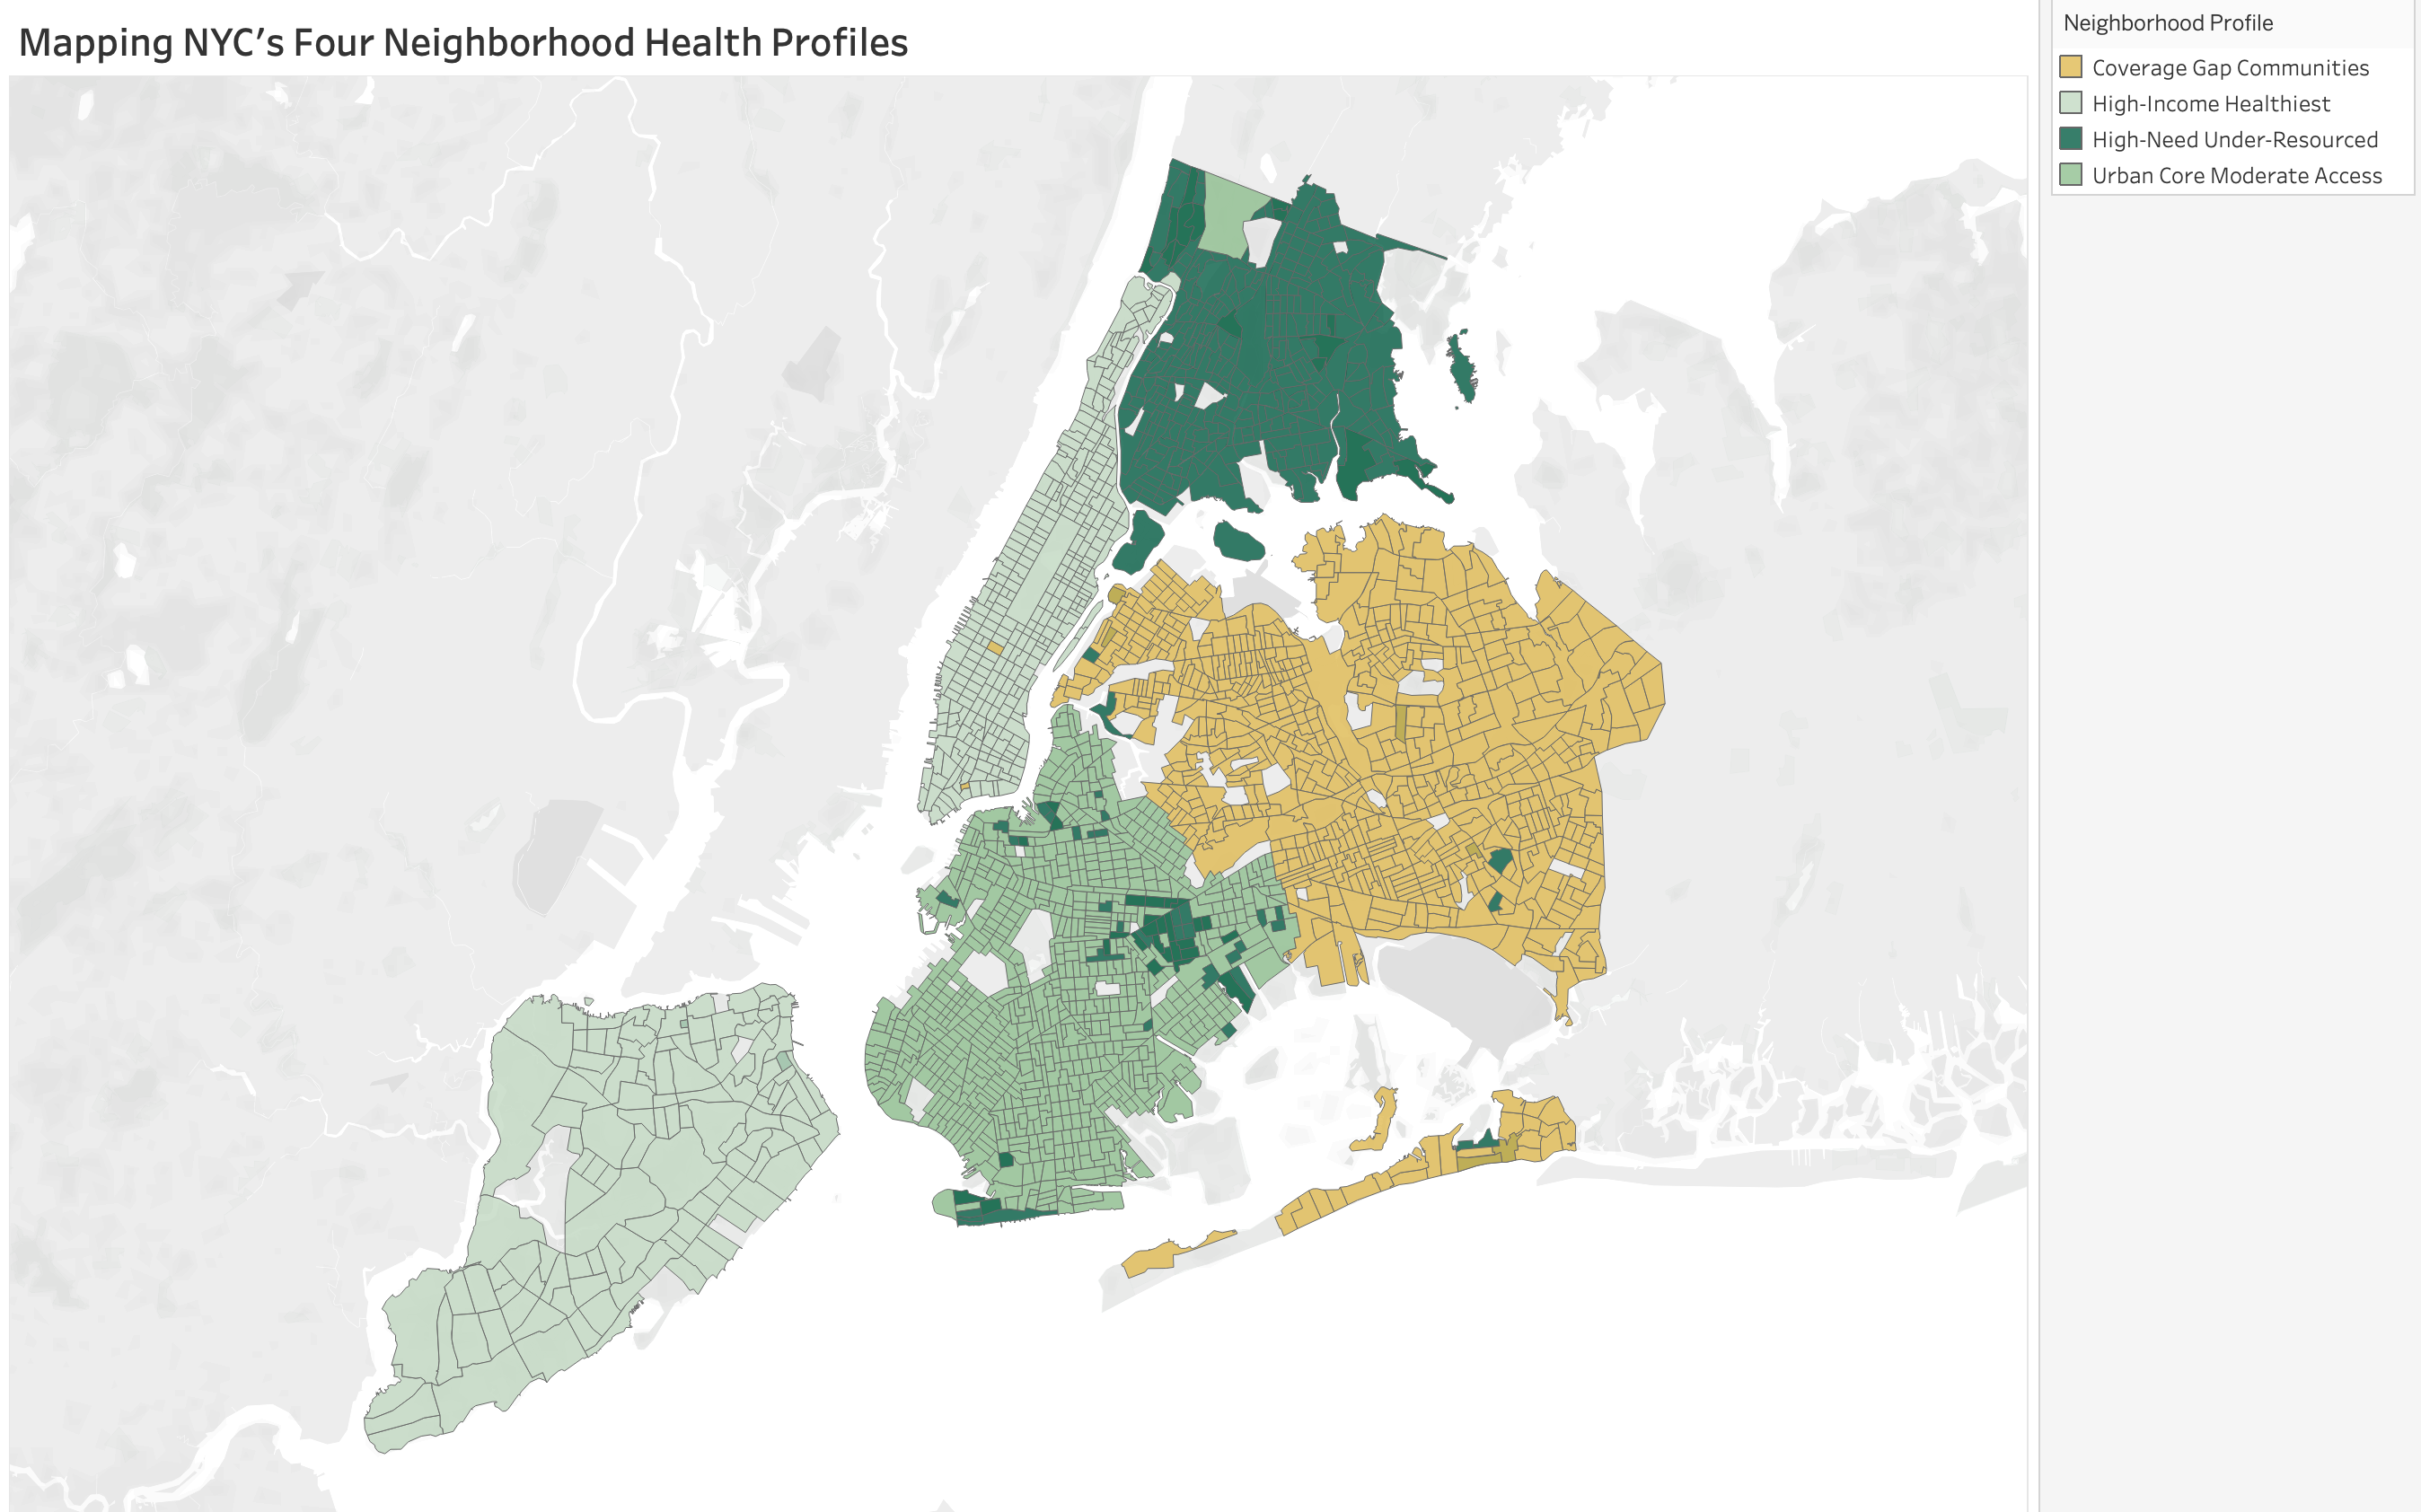
- High-need communities concentrated in South Bronx and Central Brooklyn → geographic targeting is possible
- NYC unemployment hit 17.6% during COVID, disproportionately impacting already-vulnerable neighborhoods → economic shocks compound health disparities
Geographic Segmentation
Recommendations
Where to Invest
- Prioritize South Bronx and Central Brooklyn ($53K income, 14.8% diabetes)
- These neighborhoods need integrated health and economic support, not just more clinics
- Target Queens for insurance navigation (highest uninsured rate at 7.4%)
How to Invest
- Shift from facility expansion to barrier reduction (transportation, health literacy, preventive care)
- Deploy community health workers and insurance enrollment navigators
- Build economic resilience programs in vulnerable neighborhoods
For a full technical breakdown including code, queries, and methodology, view this project on GitHub.